
 From MIT to your lab
All your assets on a map
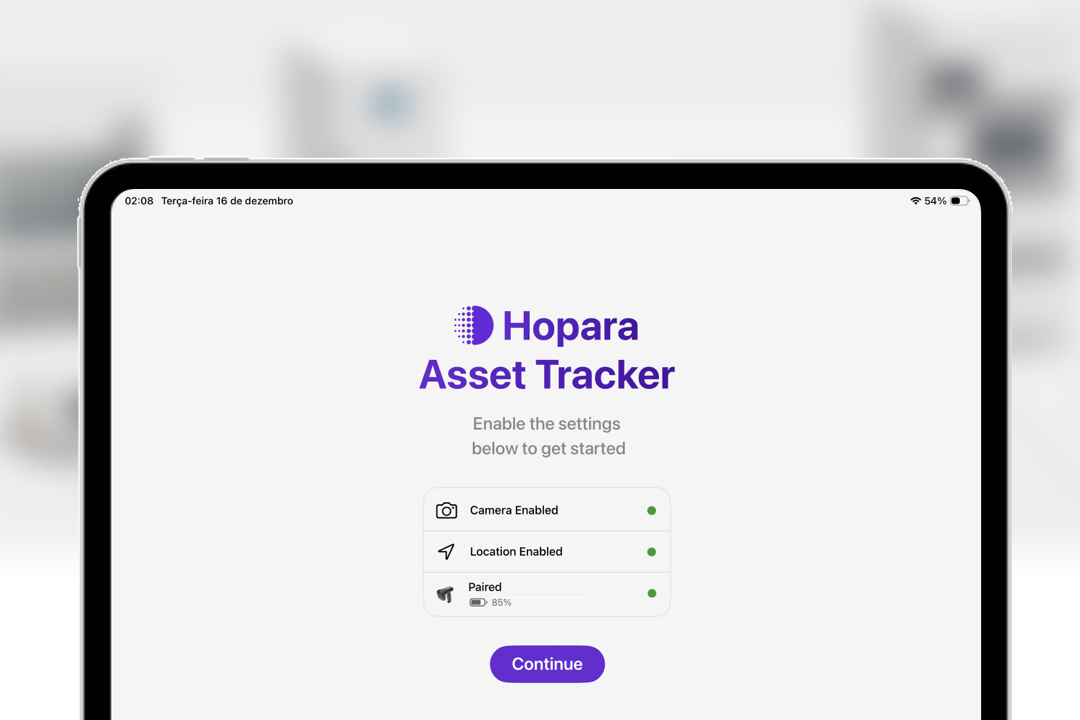
Hopara’s Indoor Positioning App turns a phone or tablet into a indoor positioning system. Walk through your lab, scan barcodes as you go, and watch your entire equipment inventory appear on a live floor plan with 1-meter accuracy.
It provides an efficient alternative for RTLS (Real Time Location Systems).
Precision without infrastructure
Most indoor positioning solutions require an infrastructure investment: beacons, antennas, access points, or dedicated readers. Hopara is different.
| Method | Precision | Infrastructure |
|---|---|---|
| Hopara (barcode scan) | ~1 meter | None — just your phone |
| Hopara (RFID reader) | ~3 meters | Handheld RFID reader |
| Traditional RFID gates | 3–5 meters | Fixed readers at entry points |
| BLE beacons | 1–3 meters | Beacons attached to every asset + gateway infrastructure |
| Manual spreadsheet | Building/room level | Nothing — and nothing accurate |
Whether you’re running a single research lab or managing a network of sites, Hopara scales without infrastructure costs.
Equipment often change location
Researchers in busy labs lose several hours every month just locating instruments. A centrifuge that moved after a renovation. A shaker that ended up two rooms away. That time adds up. And it’s not just inconvenient, it’s expensive.
- Equipment sits idle while researchers search for it
- Procurement teams buy new instruments when existing ones are underused
- Audits and compliance checks turn into manual, error-prone exercises
- New hires and contractors have no reliable way to orient themselves
Most labs manage assets with spreadsheets, printed floor plans, or institutional memory. None of these are reliable or scale.
What changes when you always know where everything is
Save researcher time
No more walking the floor looking for equipment. Search Hopara, see the map, go directly to the asset. What used to take 20 minutes takes 20 seconds.
Reduce unnecessary procurement
Before buying new instruments, see what you already own and where it is. Utilization data shows which assets are overloaded and which are idle — so redeployment decisions are backed by data, not guesswork.
Simplify compliance and audits
Generate an accurate asset inventory at any point in time. Every location update is logged, giving you a full movement history for regulated equipment.
Onboard new team members faster
New researchers and contractors can orient themselves independently using the live map. No more relying on a senior colleague to show them where everything lives.
Book equipment and raise tickets in context
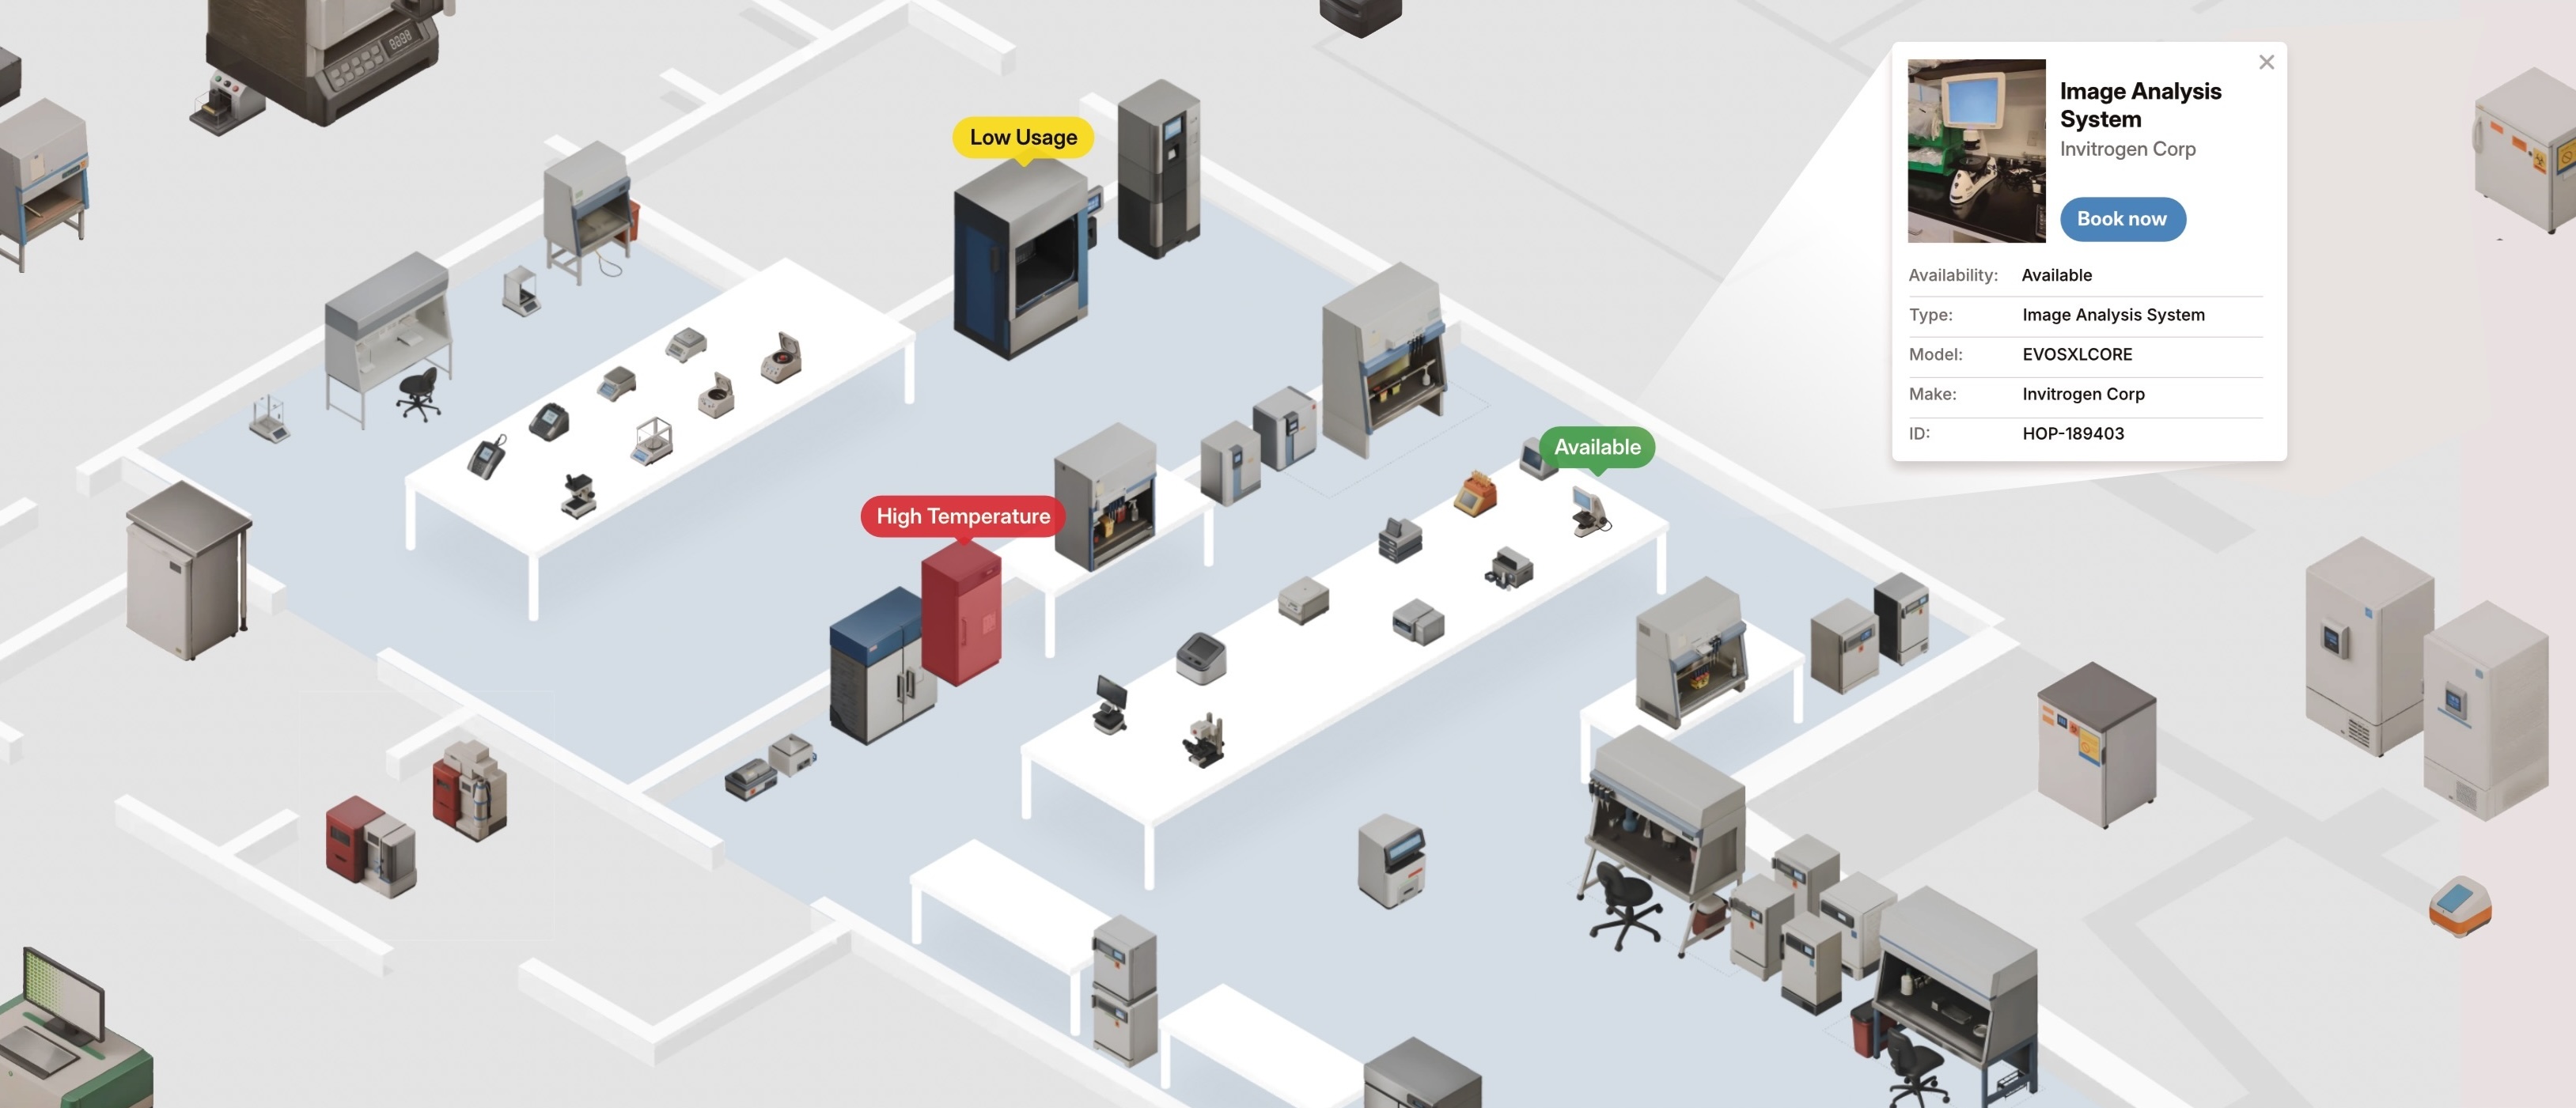
Click any asset on the map to see its availability, spec sheet, and booking calendar. Notice something wrong? Raise a service ticket directly from the asset view, already tagged with the asset ID and its precise location.
Respond to incidents faster
When a freezer alarm fires or equipment goes missing, the map shows exactly where it is. The nearest available person can be routed directly to it, no phone calls, no guesswork.