From MIT to your lab
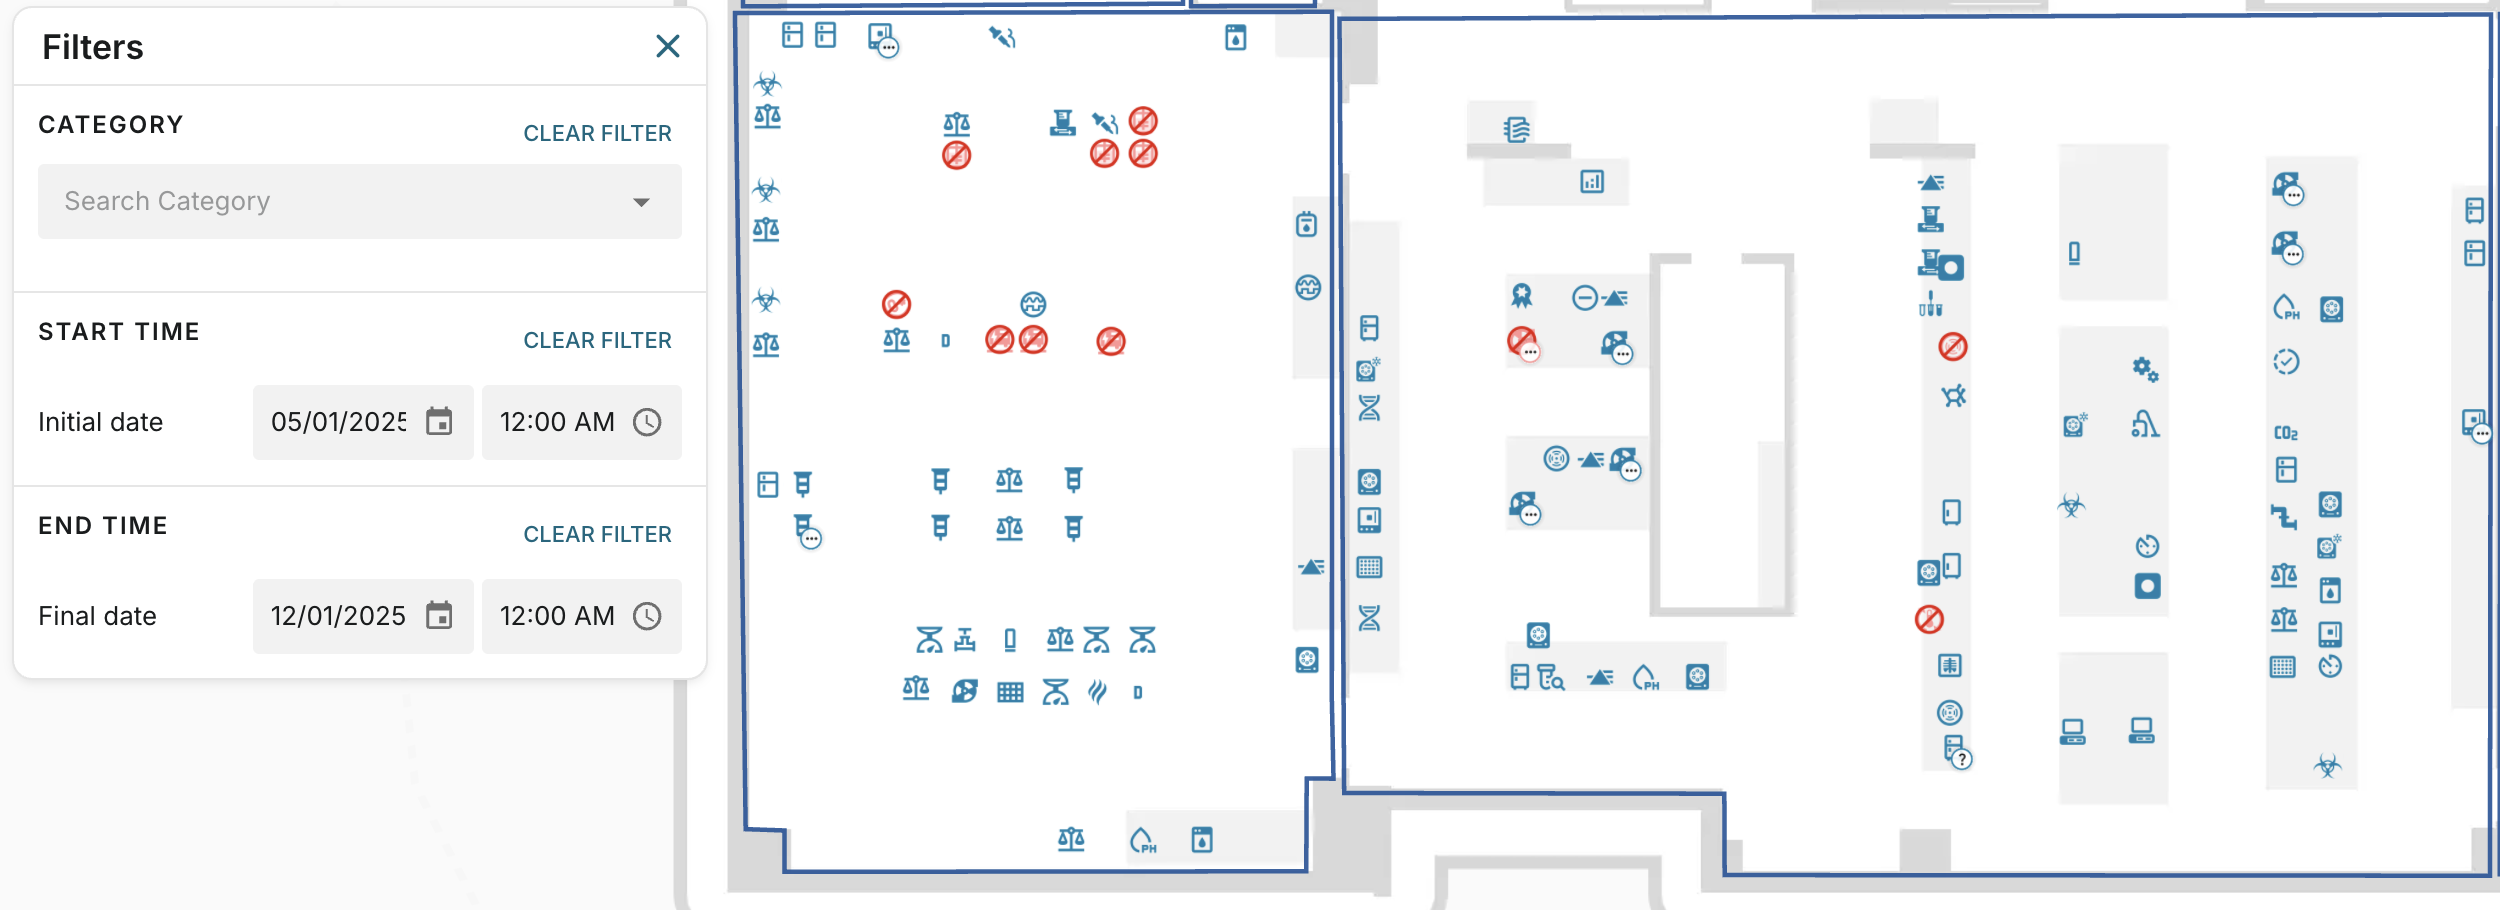
Track your assets
Know where everything is. Map your assets with 1-meter precision using the Hopara indoor positioning app. No extra hardware required.

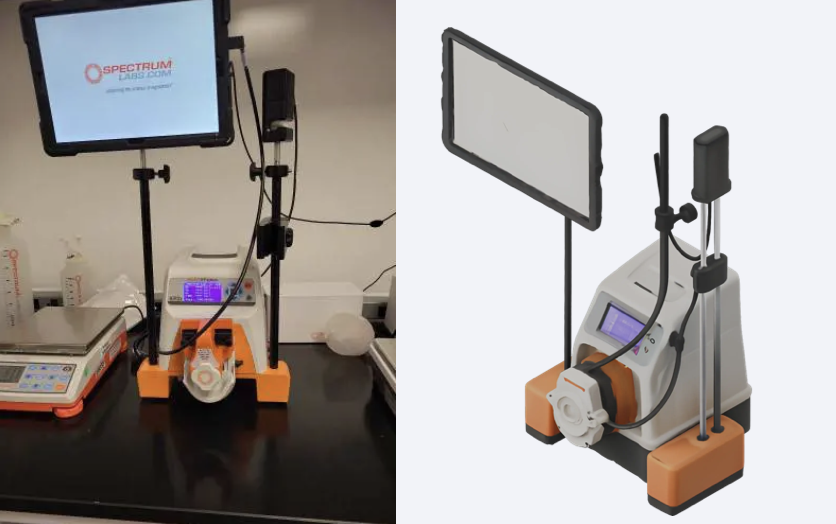
Easy to deploy
Leverage our extensive asset model library or use our photo-to-3D feature to visualize your assets. Use our no-code editor to create an view customized to your needs.
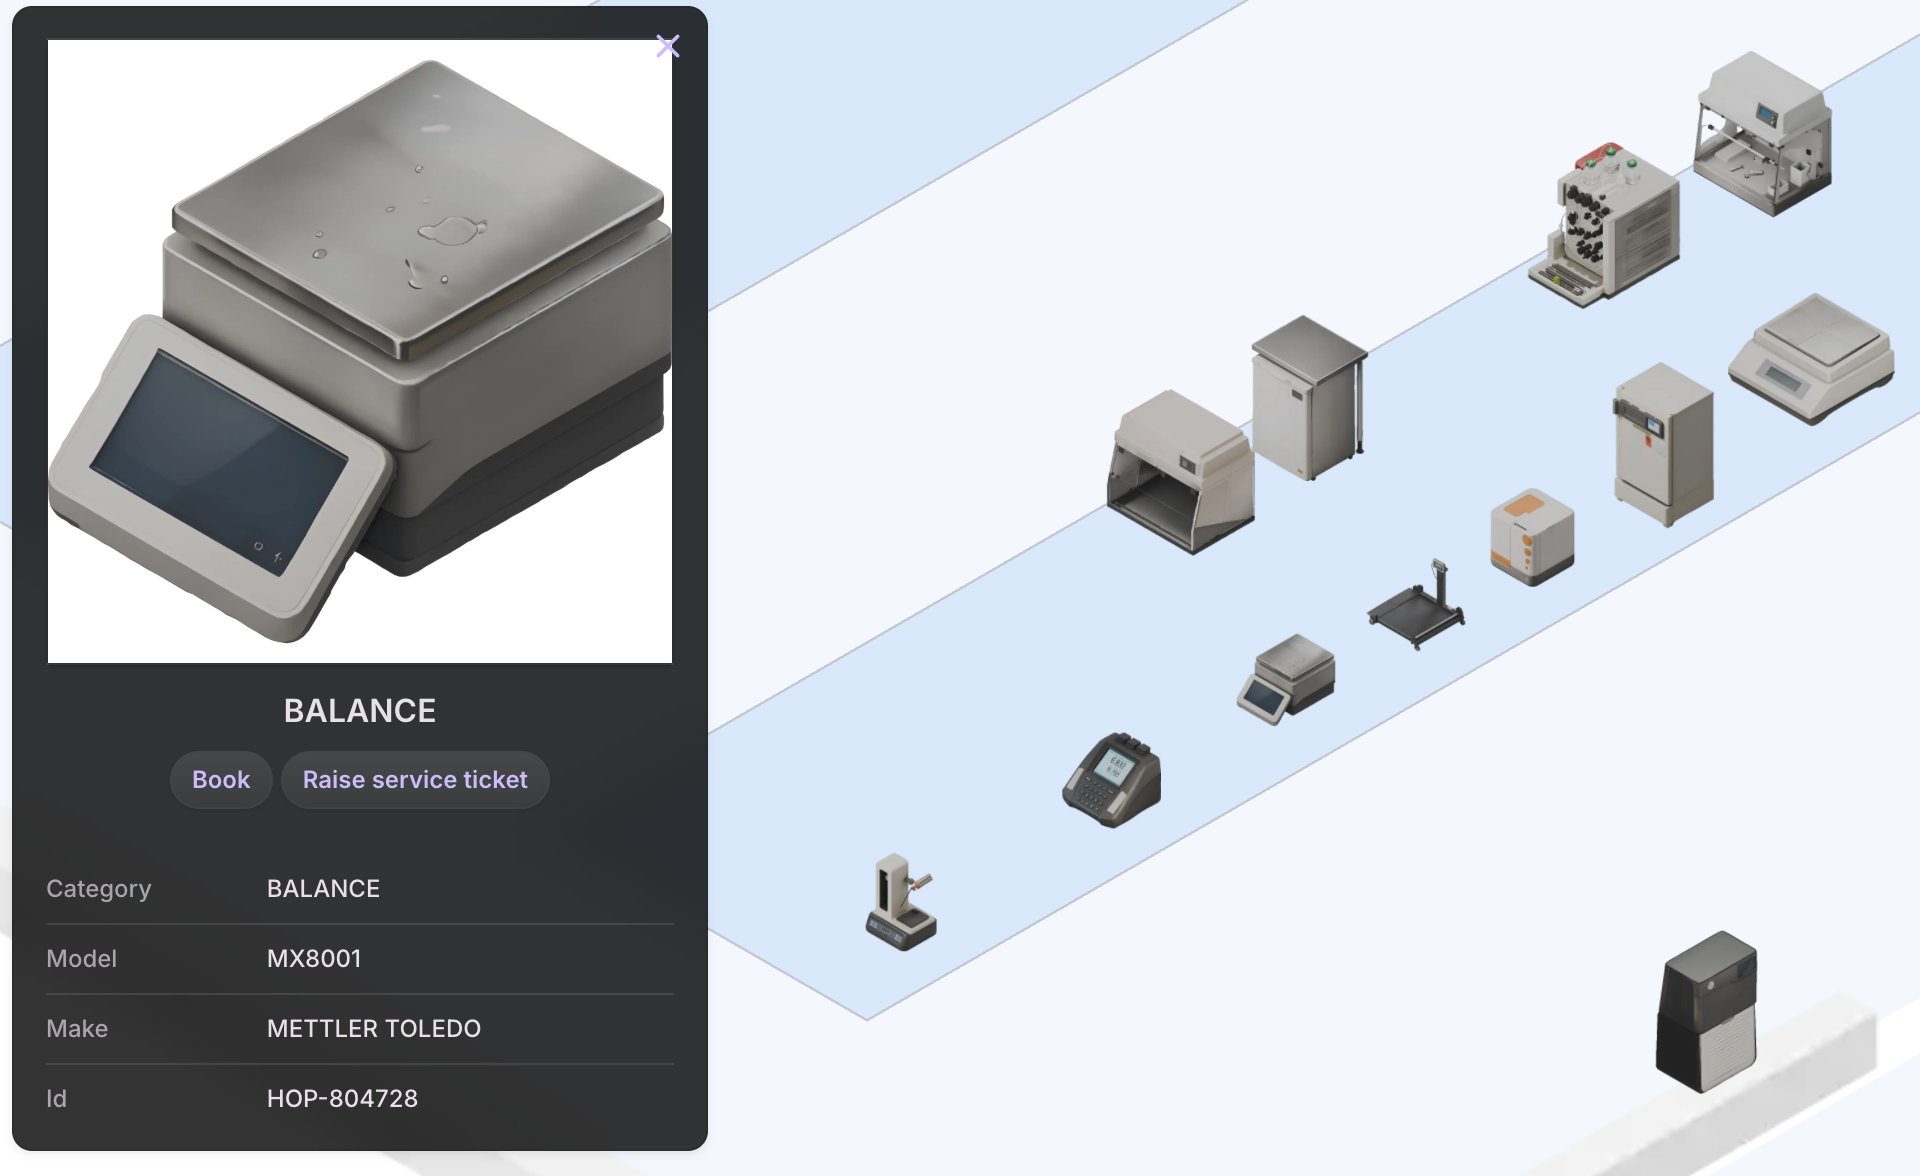
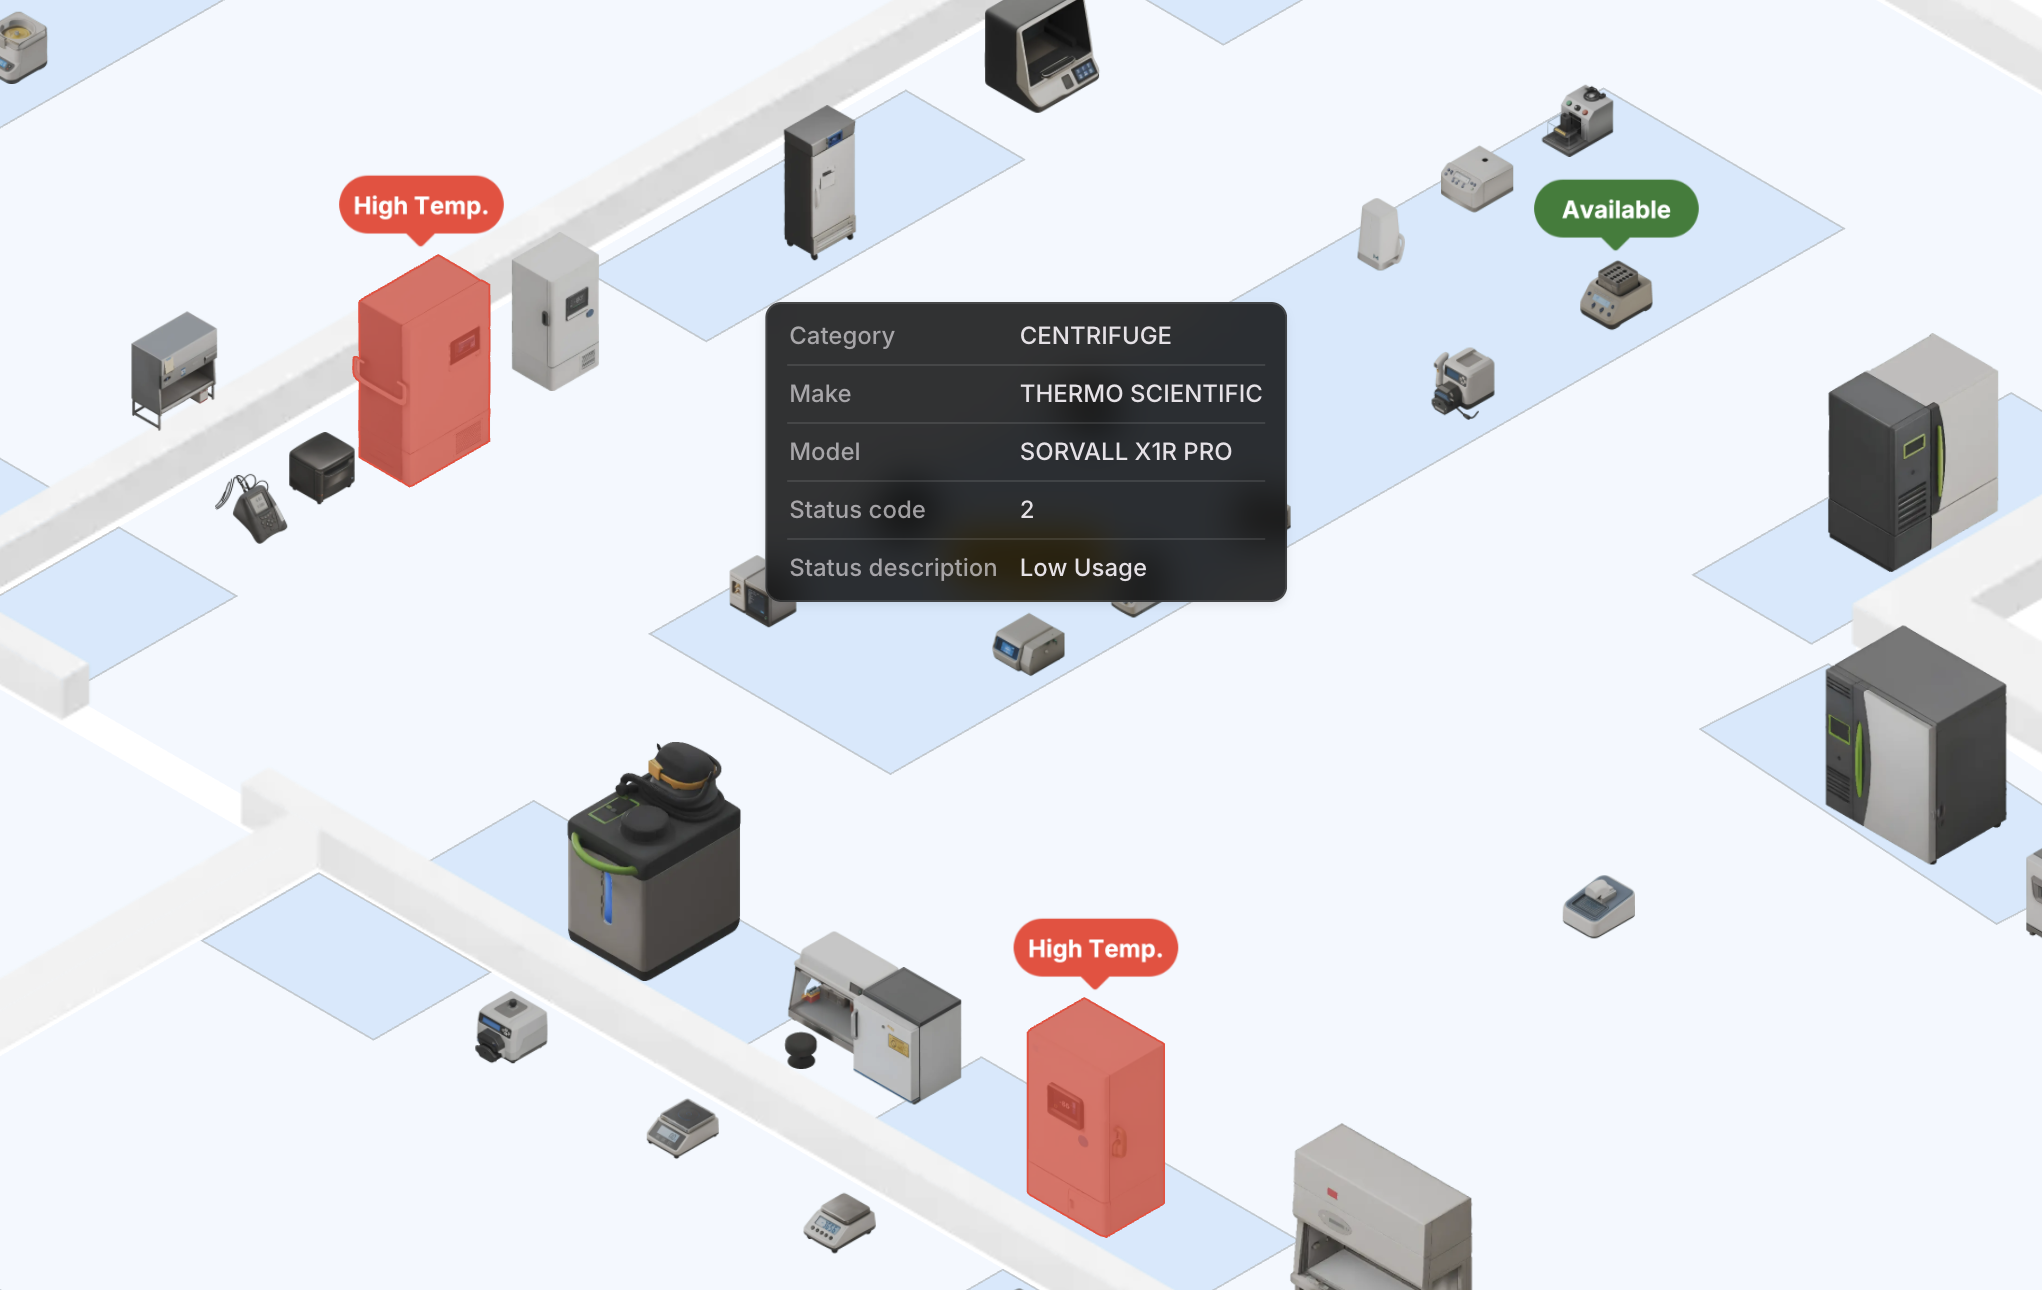
Unified View
No more juggling between different systems. Connect your LIMS, spreadsheets and other data sources to see all your data in context.
Everyday efficiency
Integrate actions to streamline everyday tasks like booking and creating service tickets.