7 ways digital twins can improve your lab
Labs run on equipment, data, and people, but most of that information lives in silos: LIMS here, spreadsheets there, knowledge in someone’s head. A digital twin changes that by creating a live, visual representation of your entire operation. Here’s what that looks like in practice.
Know where every piece of equipment actually is
Time spent hunting for equipment is time not spent on science. In large labs, researchers can lose hours every week just locating instruments that have been moved, borrowed, or relocated after a renovation.
Hopara’s Indoor Positioning App combines computer vision and inertial sensors to map assets with 1-meter precision, just walk through the lab with a tablet. No extra hardware, no barcode scanners mounted on walls, no manual inventory audits.
The goal isn’t more data it’s the right data, in context, at the moment you need it.
Be the remote control for your automated lab
As labs become more automated, the need for constant human presence on the floor decreases, but the need for oversight doesn’t. Robots, liquid handlers, and automated incubators can run around the clock, yet someone still needs to know what’s happening and be able to intervene when something goes wrong.
A digital twin becomes the natural interface for this new reality. Scientists can watch every instrument’s status in real time from anywhere, see exactly where a run is in its workflow, and trigger automation actions directly from the map, without having to be in the same building, or even the same country.
Get a bird’s-eye view across every site
Managing a single lab is hard enough. Managing dozens of labs across multiple countries, each with its own systems, naming conventions, and reporting formats, is an operational nightmare.
A digital twin gives you a unified global view: a world map showing all your sites, with the ability to drill down from country to building to room to individual bench. Alerts, utilization data, and equipment status are all visible from the same interface.
Eliminate equipment bottlenecks before they happen
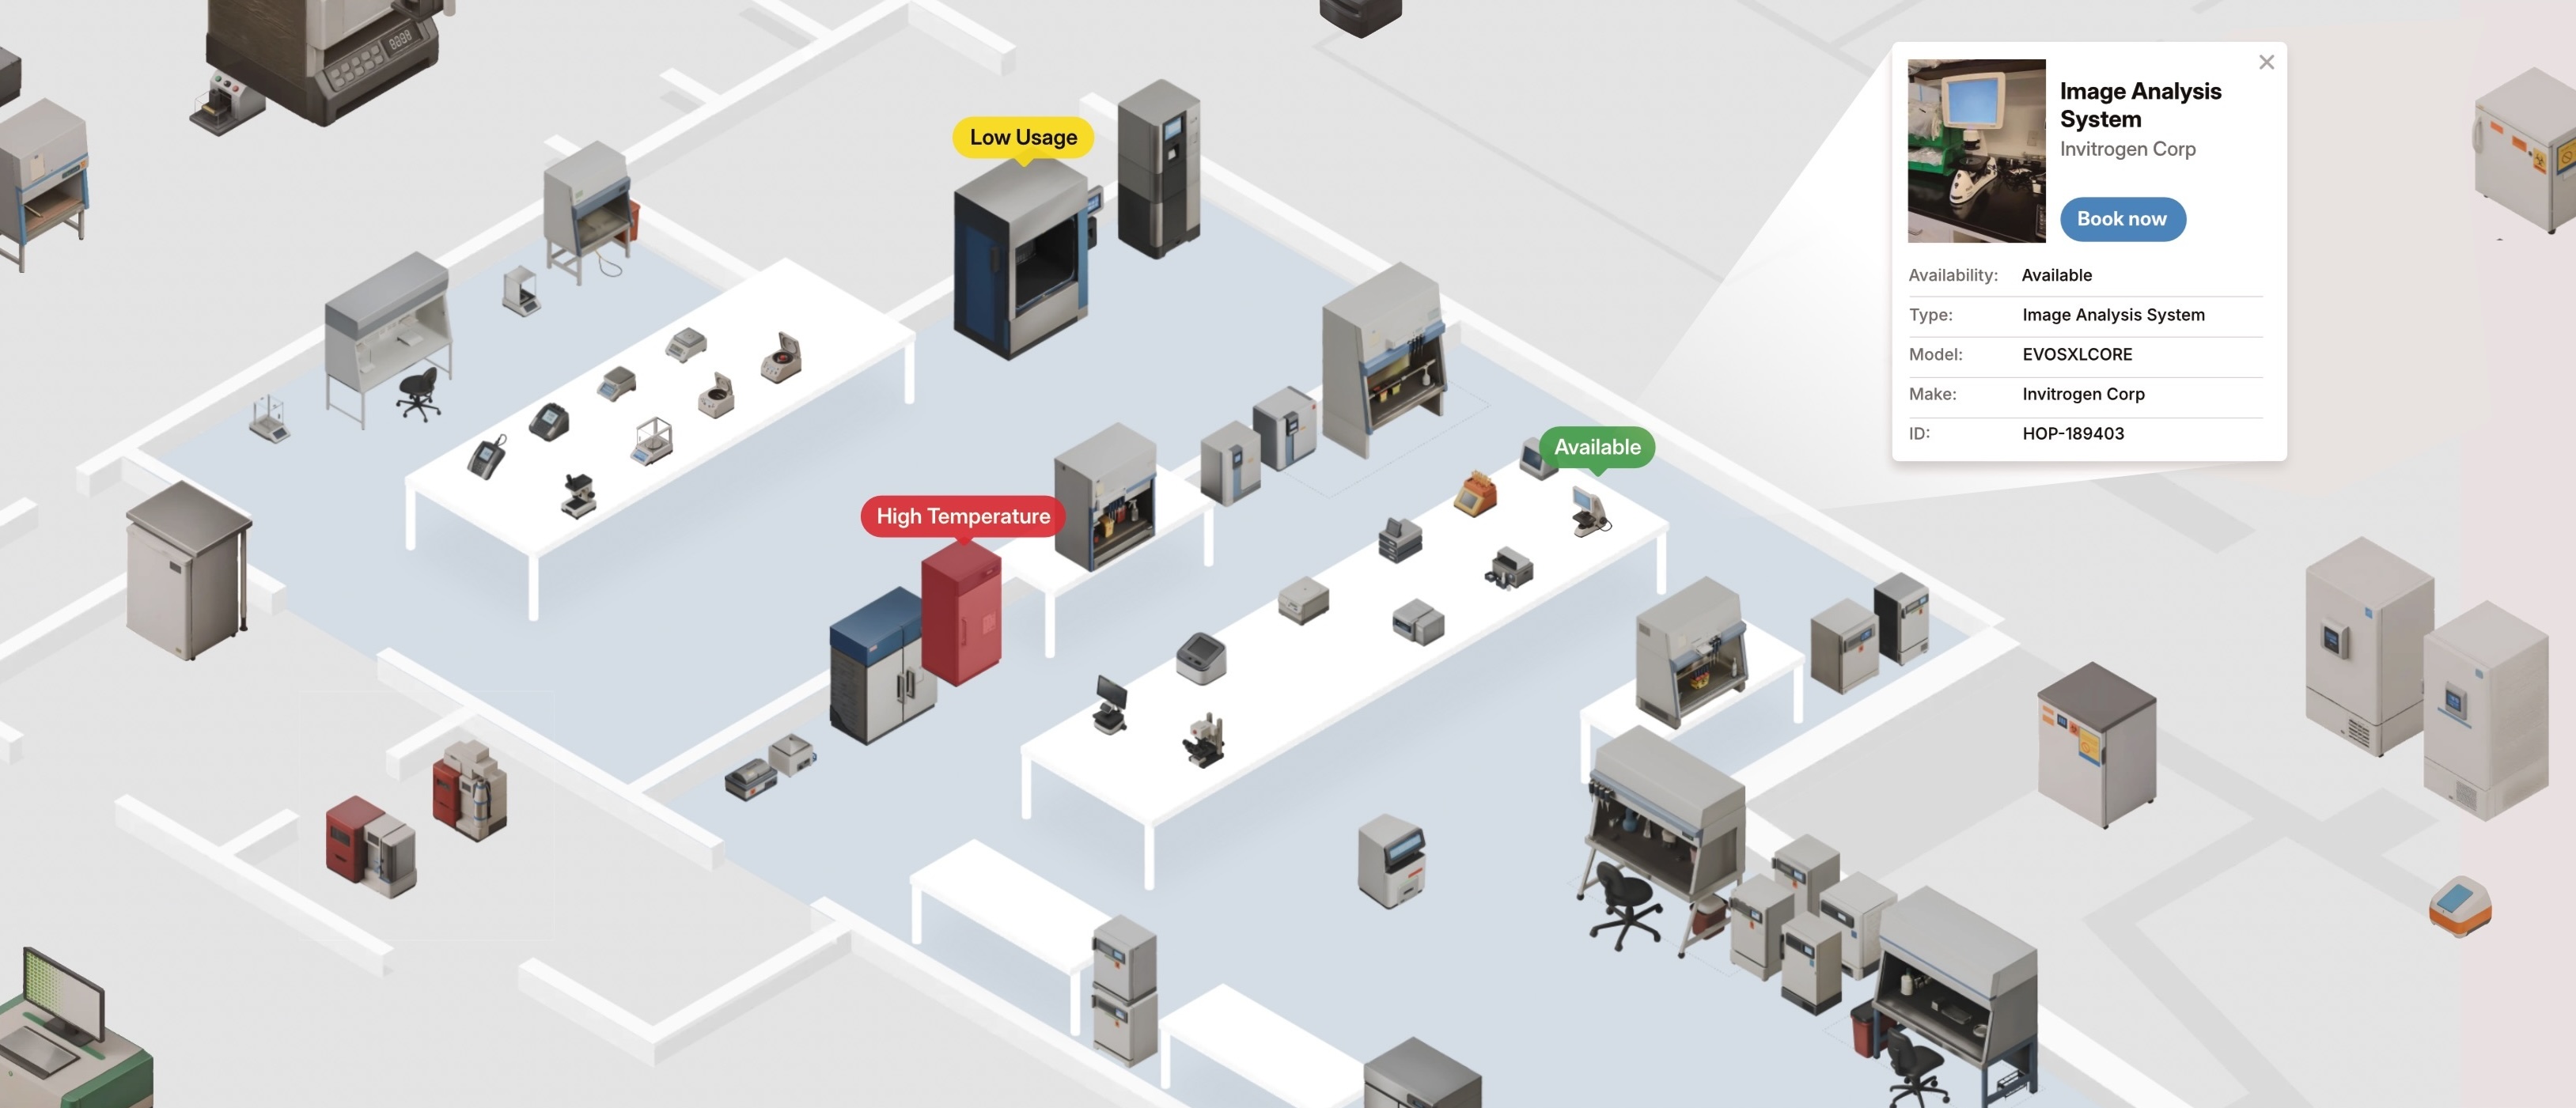
Capacity planning in most labs is reactive: you discover a bottleneck when a researcher has to wait two days to use a centrifuge. With a digital twin, utilization data is visualized spatially on the lab floor plan, rooms and benches colored by utilization rate, updated in real time.
This makes it immediately obvious which equipment is overloaded and which is sitting idle. You can model the impact of adding, retiring, or relocating instruments before making any physical changes.
Visualize and optimize your lab workflows
Every lab has workflows, sequences of steps, equipment, and people that need to come together to produce a result. Cell therapy manufacturing, for example, might involve a dozen steps across multiple rooms and instruments.
Hopara lets you map workflows spatially on your lab floor plan, linking steps to the physical locations and instruments involved. You can see path lengths, identify redundant movement, and spot opportunities to rearrange equipment for shorter, faster workflows.
Streamline everyday tasks like booking and service tickets
A significant share of lab downtime comes from administrative friction: figuring out if an instrument is available, submitting a maintenance request, finding the right contact when something breaks.
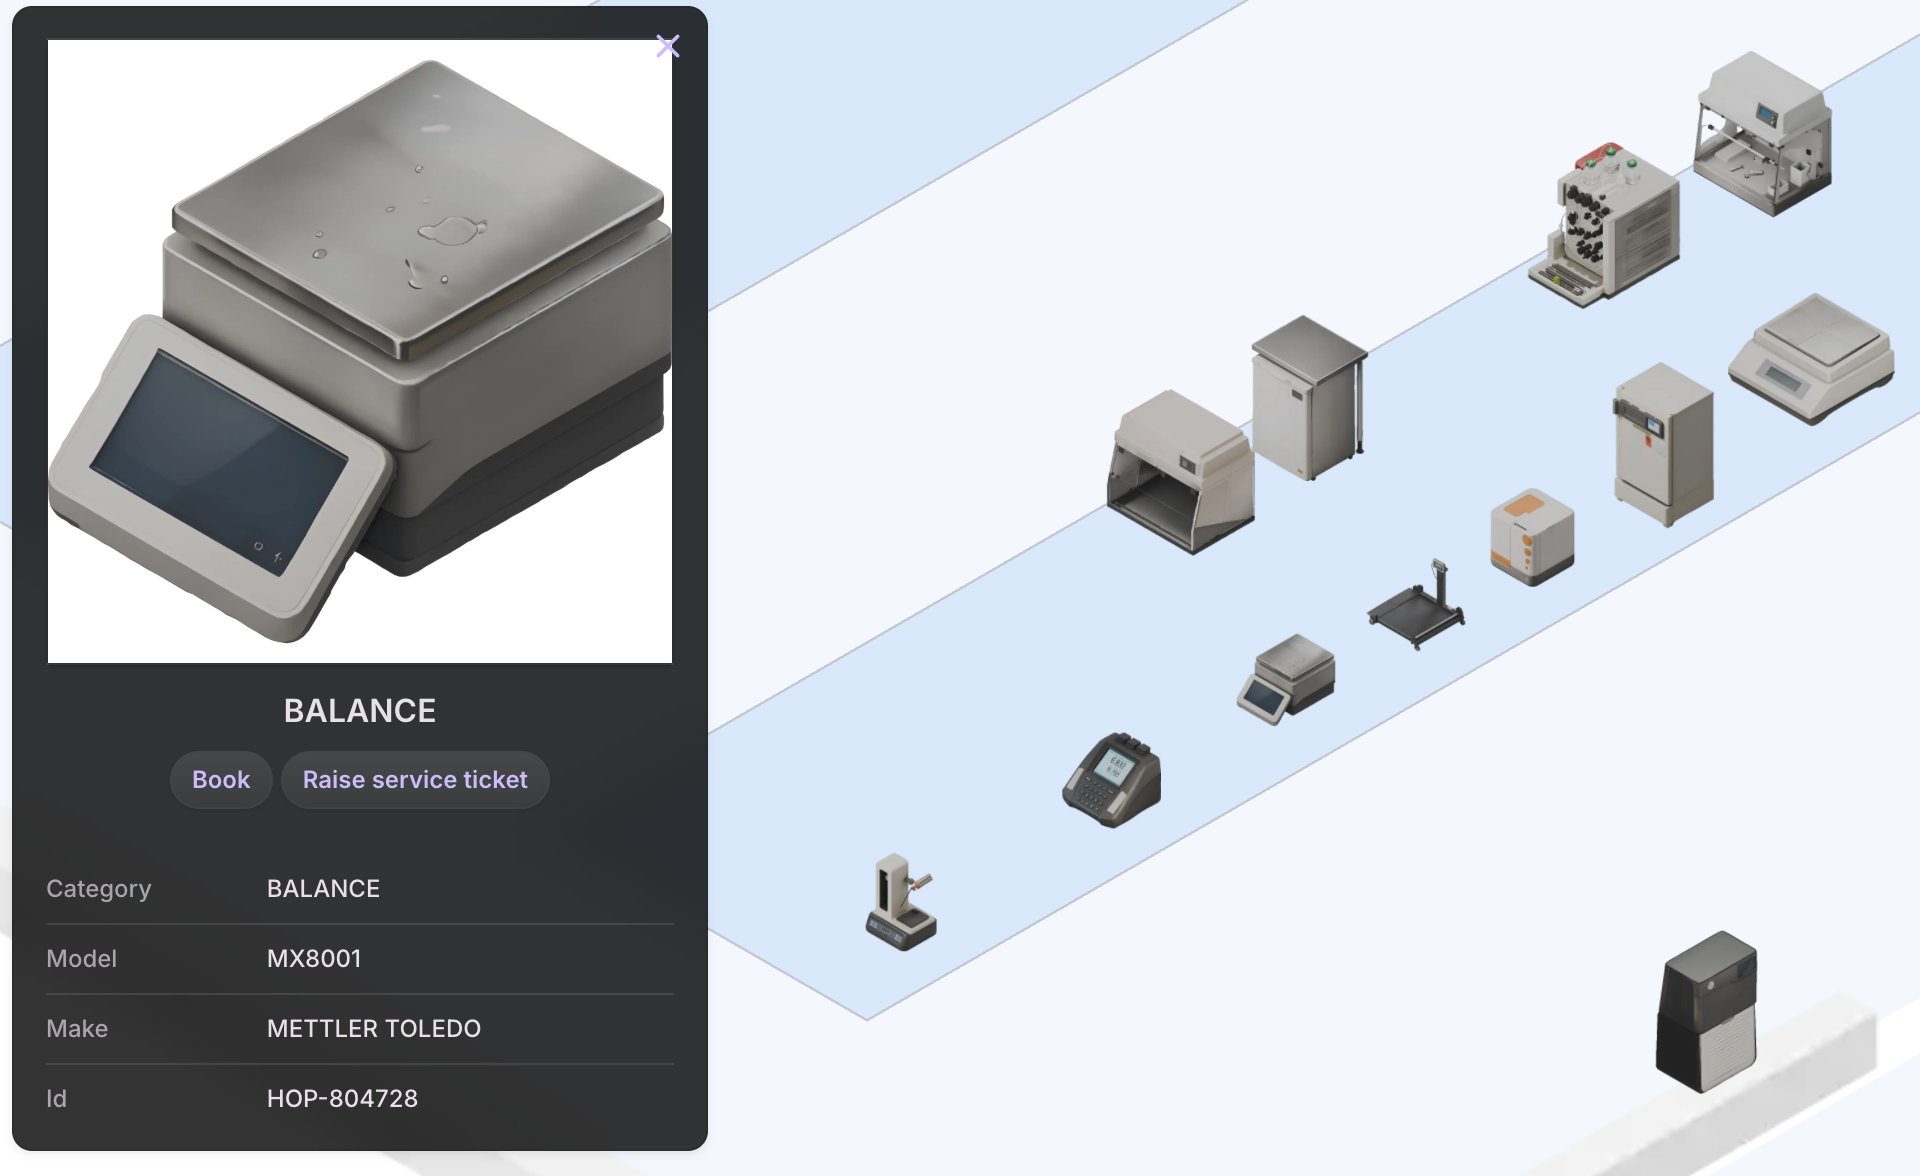
When your lab is represented as a digital twin, every asset becomes interactive. Click on a shaker and you see its availability, specs, and booking calendar. One more click and it’s reserved. Notice something wrong? Raise a service ticket from the same interface, already tagged with the asset ID and location.
Respond to incidents faster with real-time monitoring
When a freezer alarm goes off, minutes matter. Without a digital twin, the response starts with a phone call, then someone trying to remember which freezer is in which room, then a walk across the building.
With real-time monitoring overlaid on the lab map, incidents are immediately visible: the affected asset lights up, its location is shown, and the nearest available person can be routed directly to it. IoT sensor data, AI model outputs, and manual inputs all feed into the same visual layer.
Your lab more efficient
Get in touch to talk about your specific operation or about licensing Hopara technology to your product.