Hopara: Real-Time Data Visualization
Hopara provides a software platform that enables visualization of data from different data streaming platforms.
Why Hopara
Our platform allows teams to analyze, interact with, and act on data in real-time.
Advanced & Real-Time Data Analysis
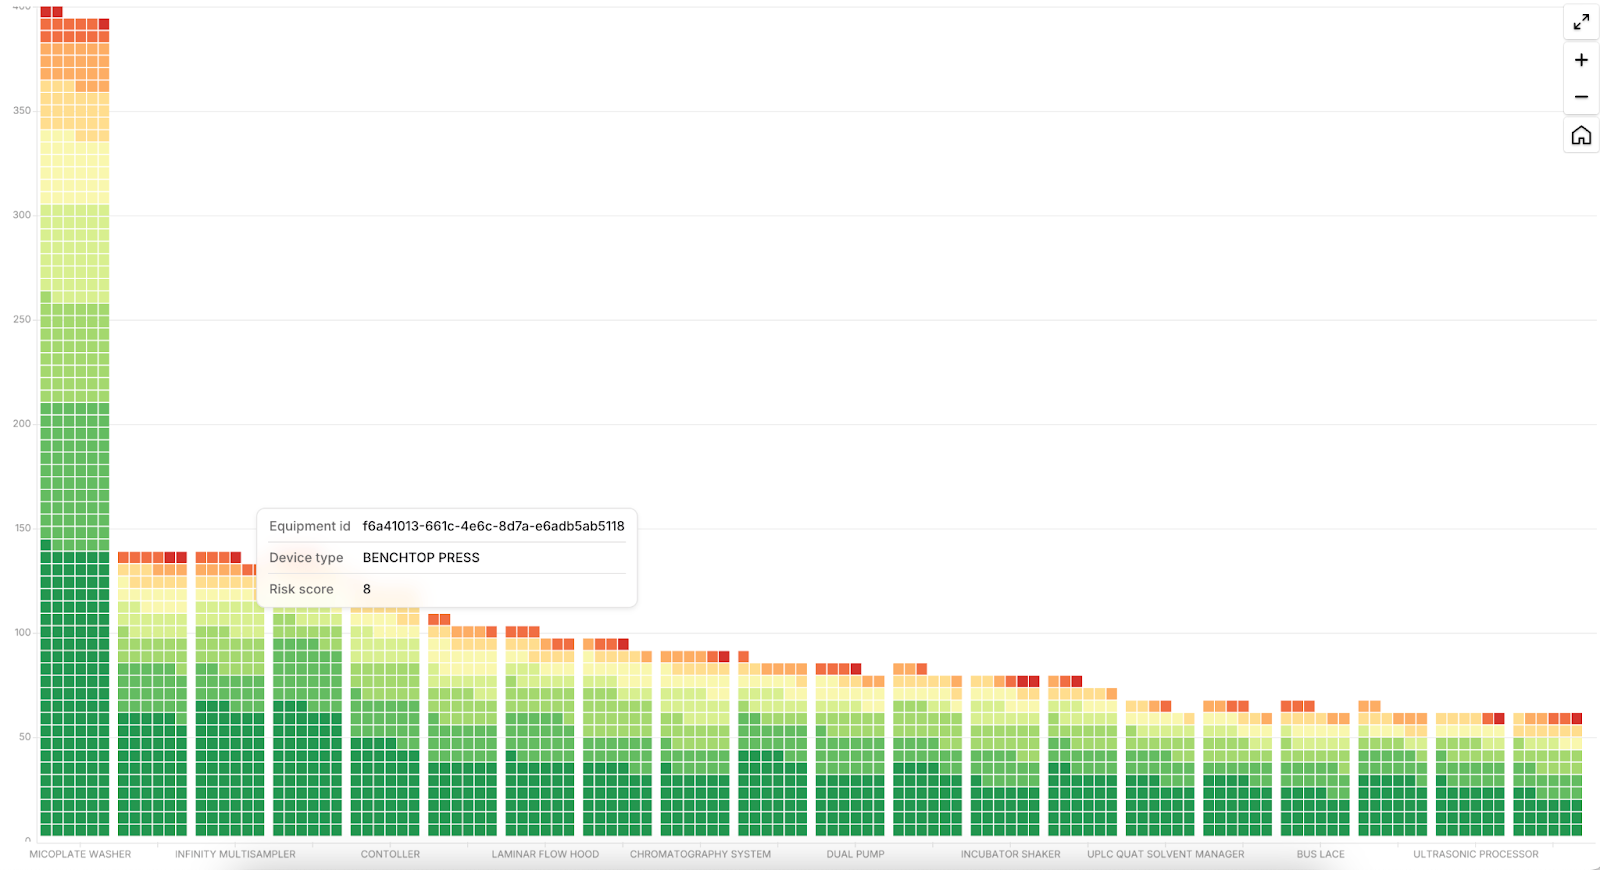
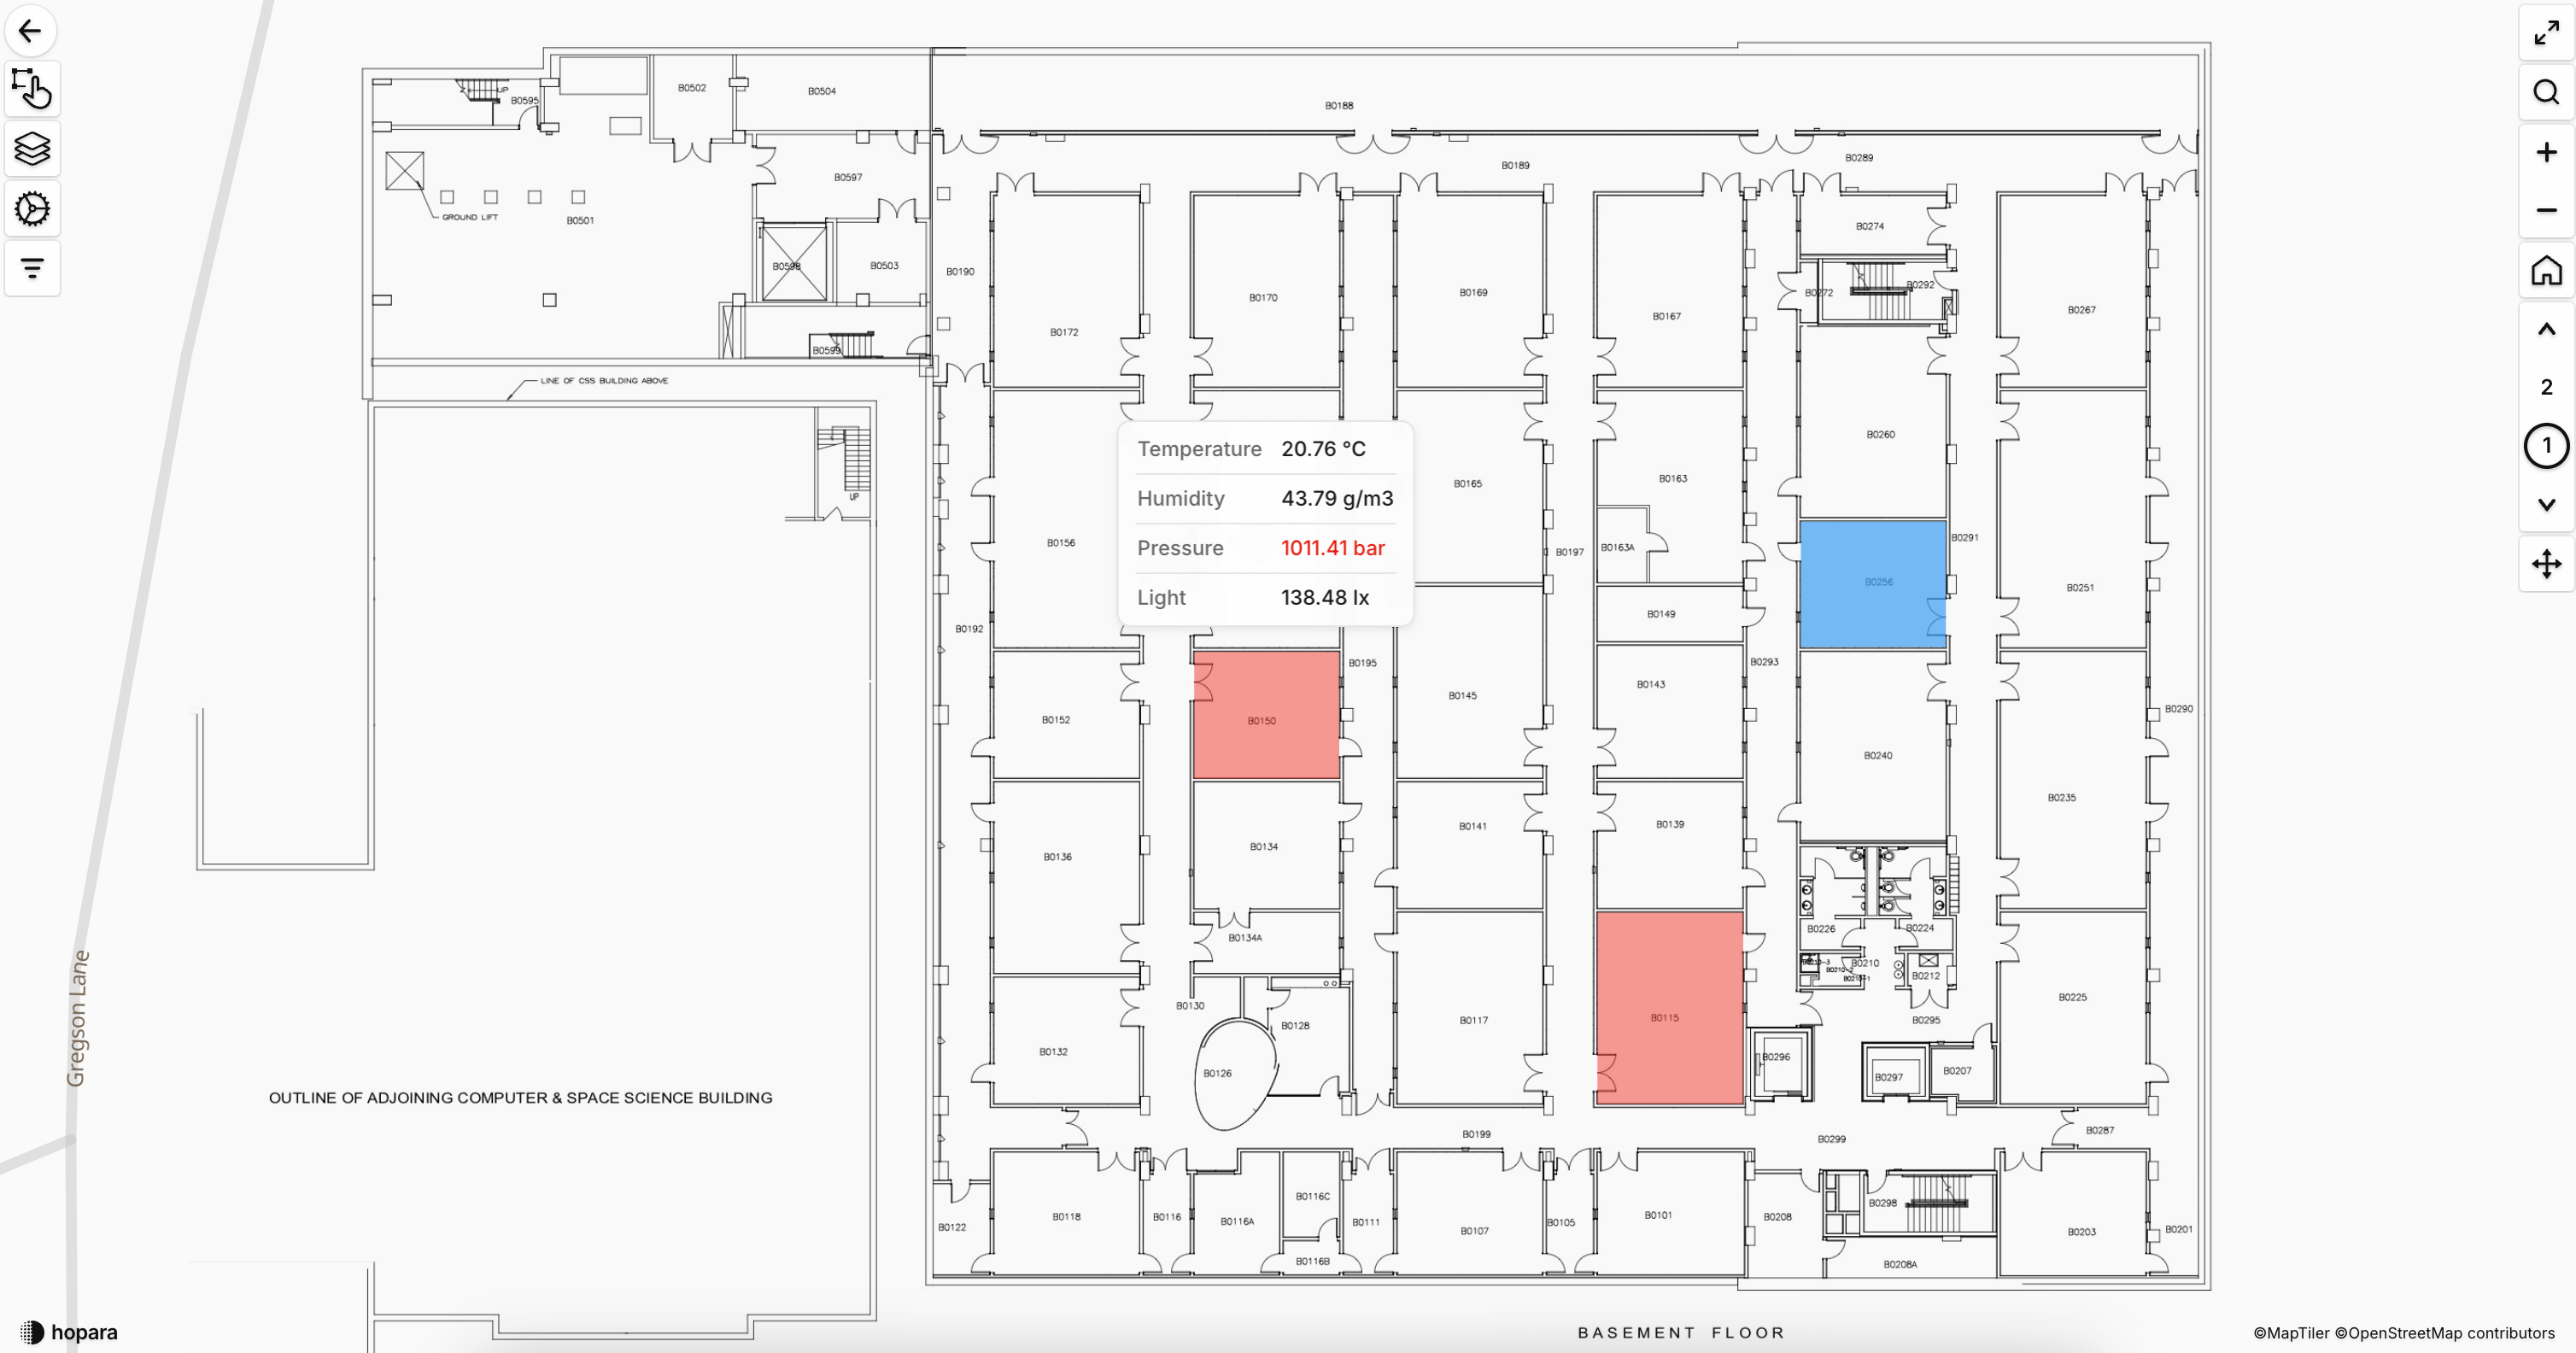
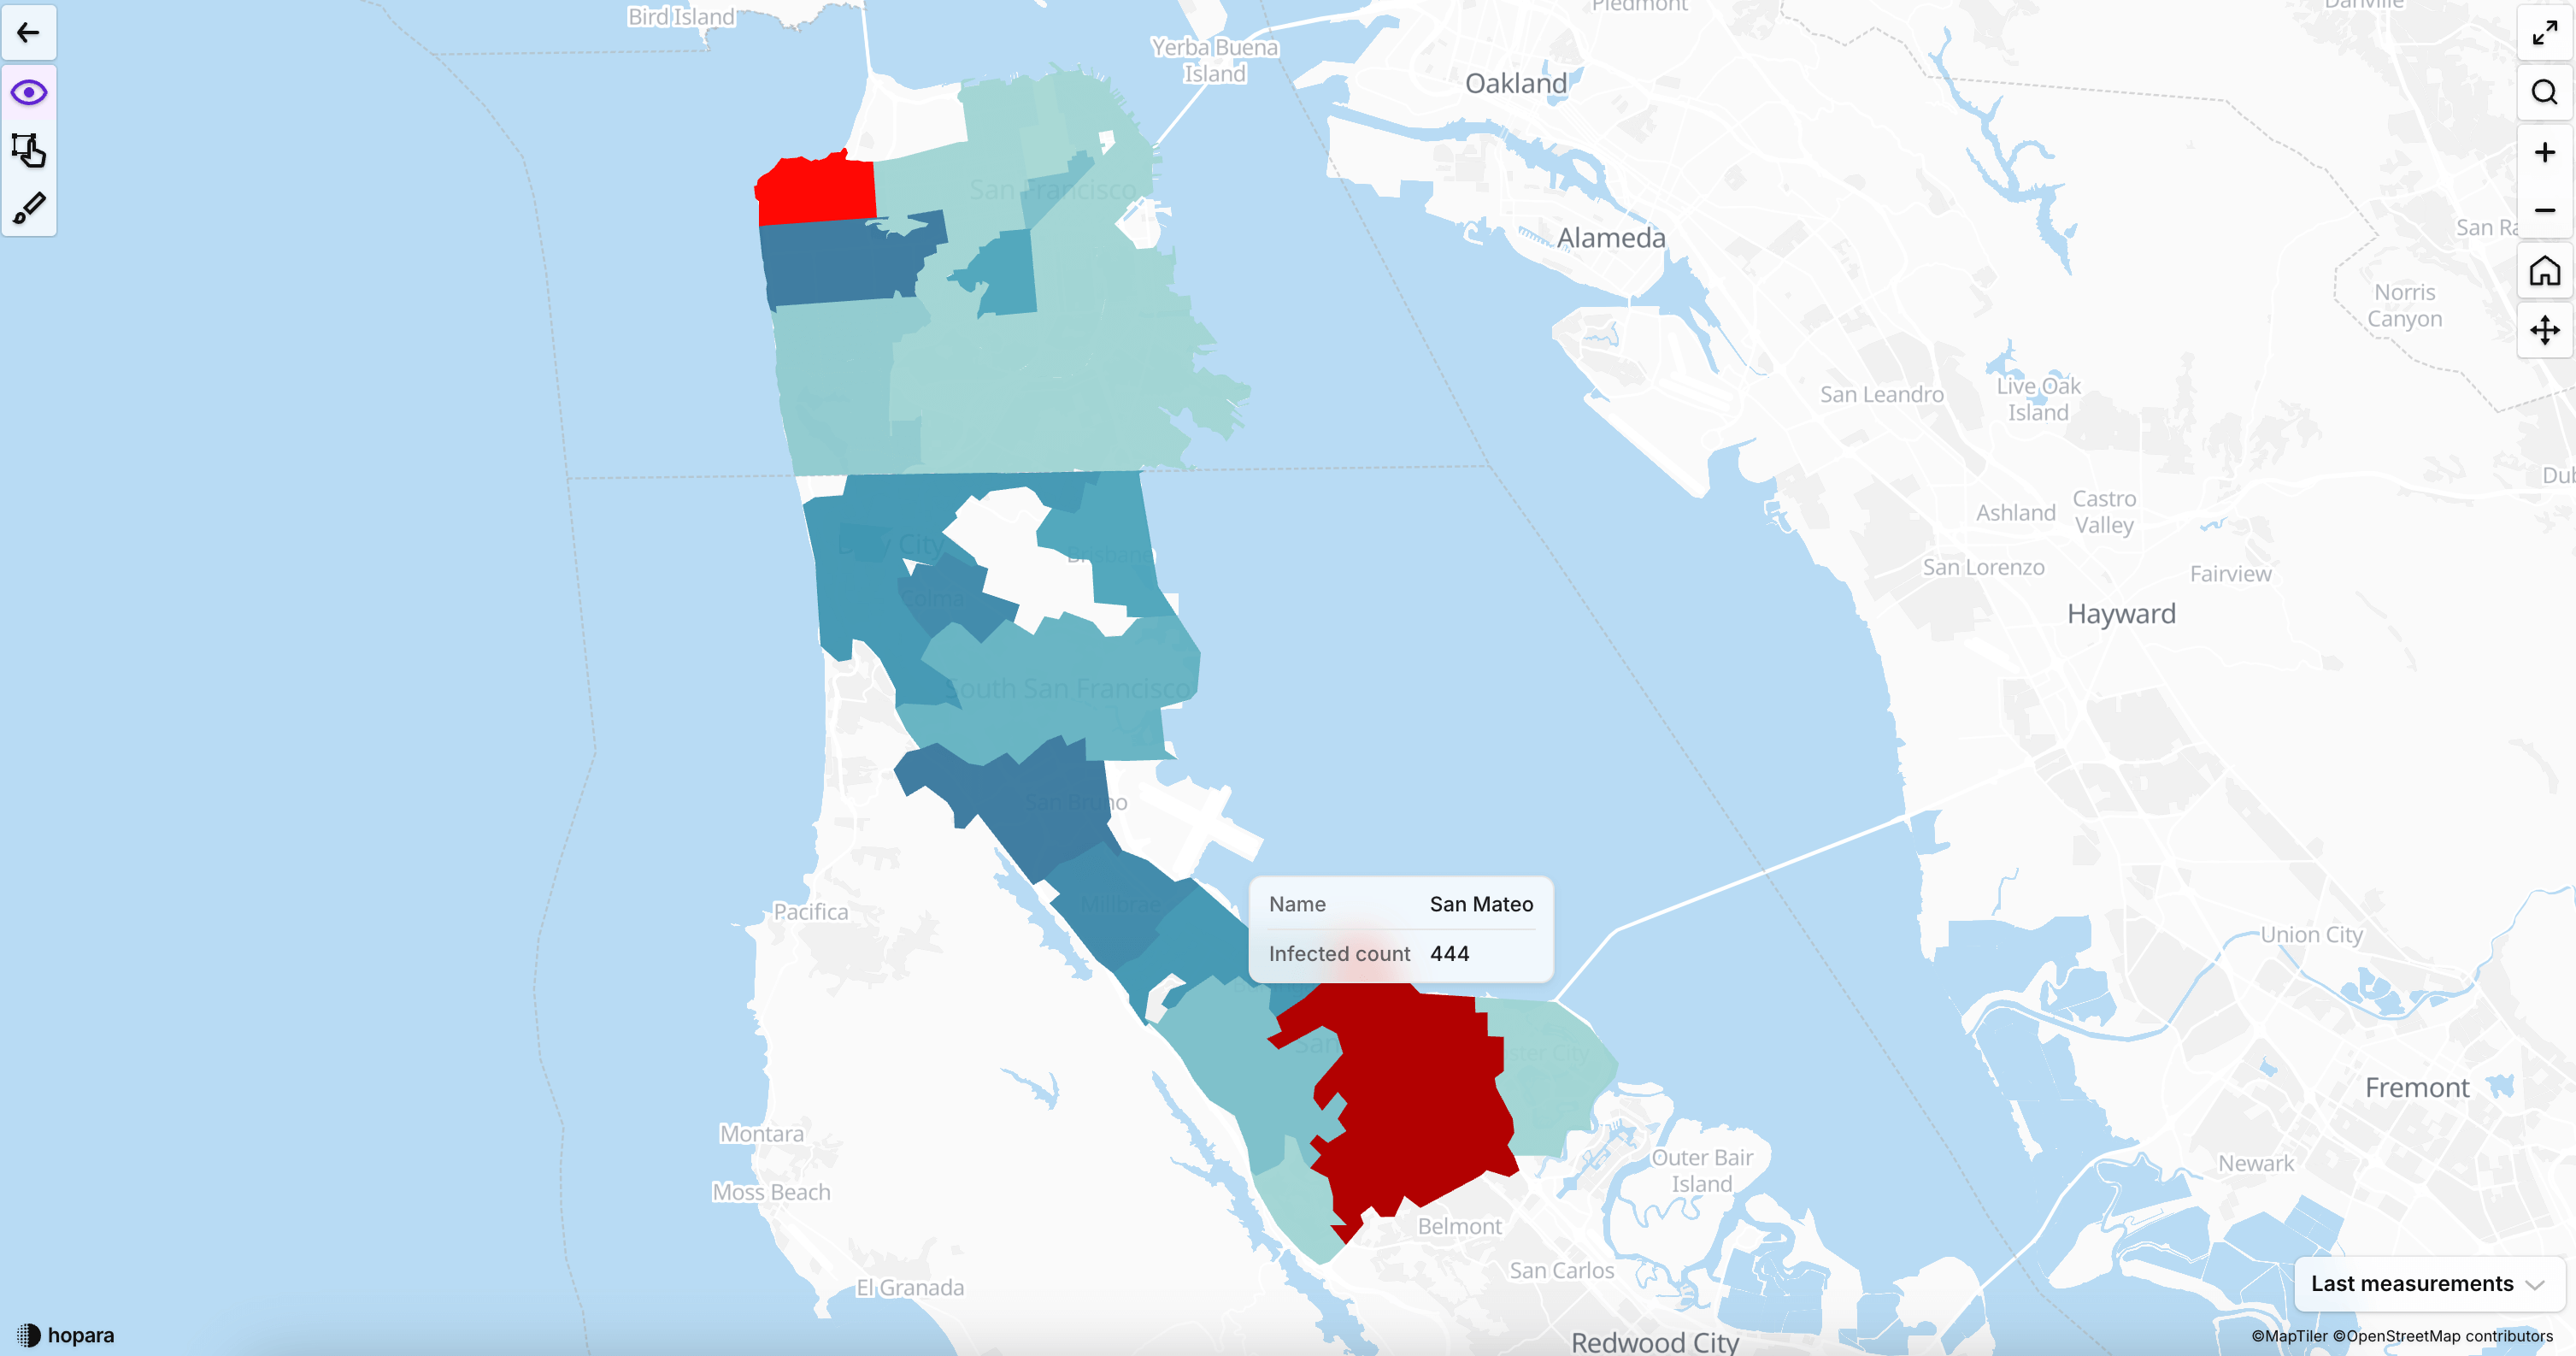
- Visualize and analyze data streams in real-time to detect patterns, identify anomalies, and respond proactively.
- Leverage machine learning and predictive analytics to enhance operational efficiency and mitigate risks.
- Enable collaborative data exploration with intuitive dashboards and interactive models.
Seamless Integration
with Other Tools
- Connect with a wide range of data, including databases, CRMs, ERPs, data warehouses, data lakes.
- Use API to integrate with custom applications and workflows.
- Sync with cloud data platforms like Snowflake, Confluent, and Kafka for real-time data ingestion.
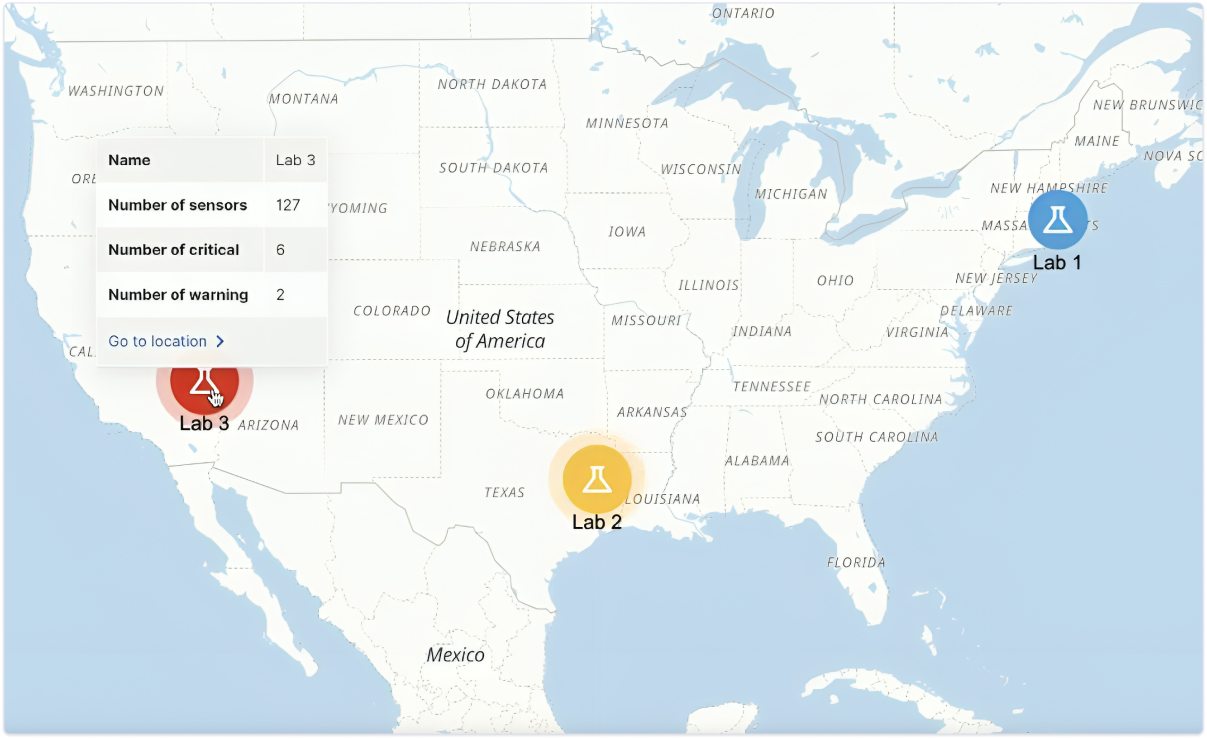
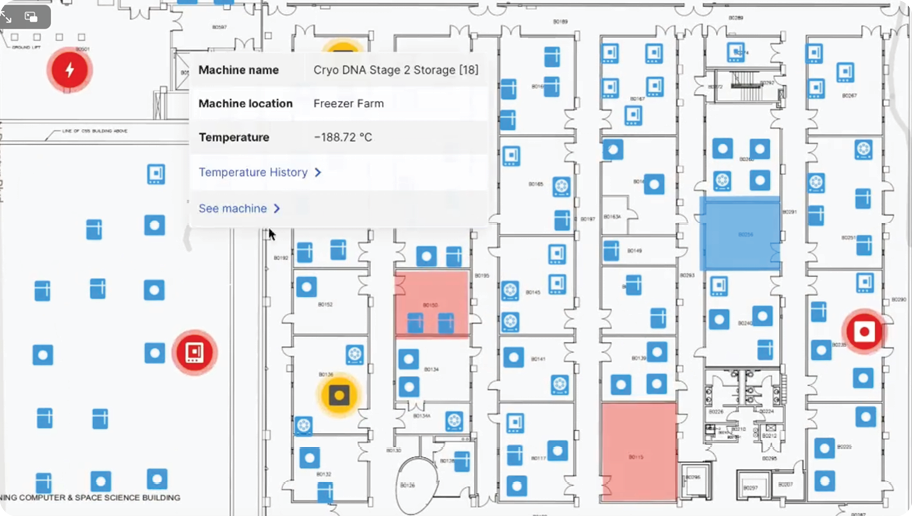
- Sync with IoT devices in manufacturing, pharmaceutical labs, hospitals, etc.


Interactive & Actionable Interface
- Interactive User Interface: providing users the ability to visualize the data in 2D or 3D and be able to drill down and act on the data.
- Exclusive Actionable features:
- External systems: Take the user to an external system (e.g. Confluent, ServiceNow, Snowflake, Kafka, etc.)
- Jump to visualization: Take the user to another related visualization (e.g. go to this machine metrics)
- Callback function: Call a user-specified javascript function. Can be used to do anything.
Integration Capabilities
Hopara seamlessly integrates with diverse data sources, ensuring secure and efficient connectivity across cloud, streaming, and on-premise environments.

Data Source Compatibility
Hopara seamlessly connects with:
- Cloud-based data (Snowflake, AWS S3, Google BigQuery, Azure Data Lake)
- Streaming platforms (Apache Kafka, Confluent, RabbitMQ, MQTT)
- IoT sensors and device telemetry data for real-time monitoring
- On-premise databases and hybrid cloud solutions
Authentication & Security
Enterprise-grade security for seamless protection.
- Secure enterprise data with SAML-based authentication and Single Sign-On (SSO) support.
- Implement granular access controls to ensure compliance with security and privacy standards.
Scalability
Scale effortlessly with real-time data streaming and high-performance processing to handle growing workloads with ease.
- Process and visualize large, complex datasets at high-speed rendering and optimized performance.
- Scale effortlessly across multi-cloud and hybrid environments to support enterprise-level data needs.
Customer Stories