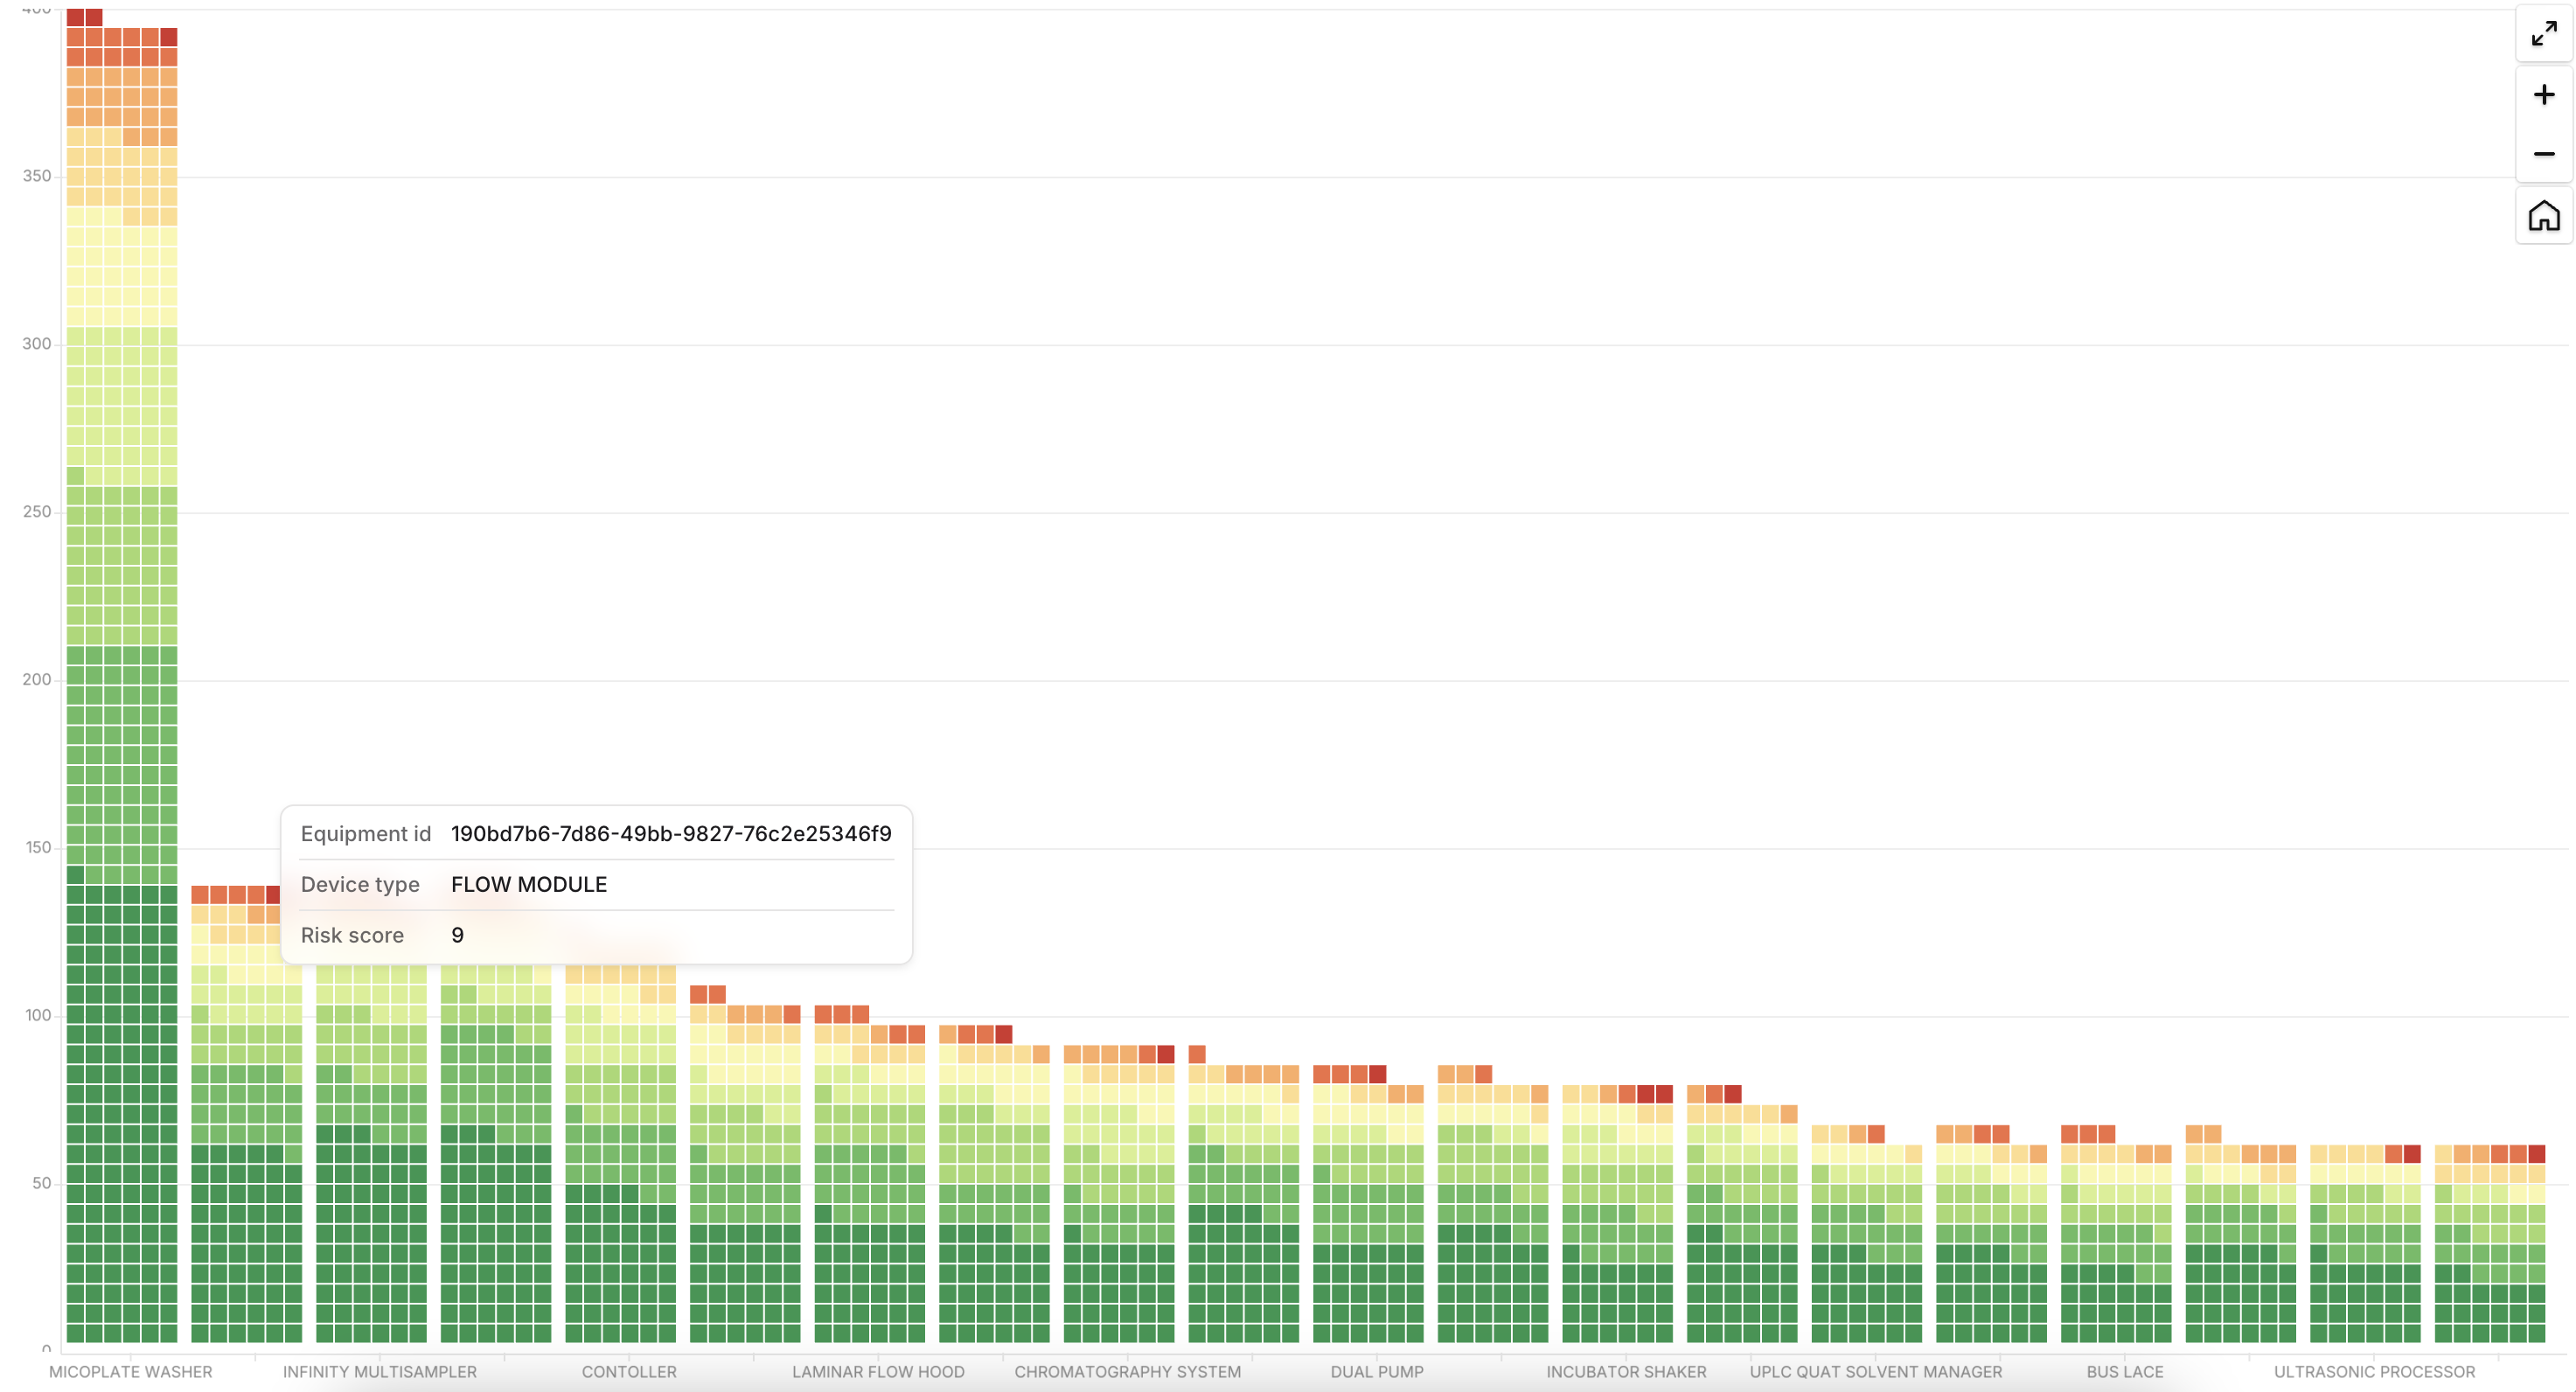
Real-time manufacturing data visualization and asset monitoring
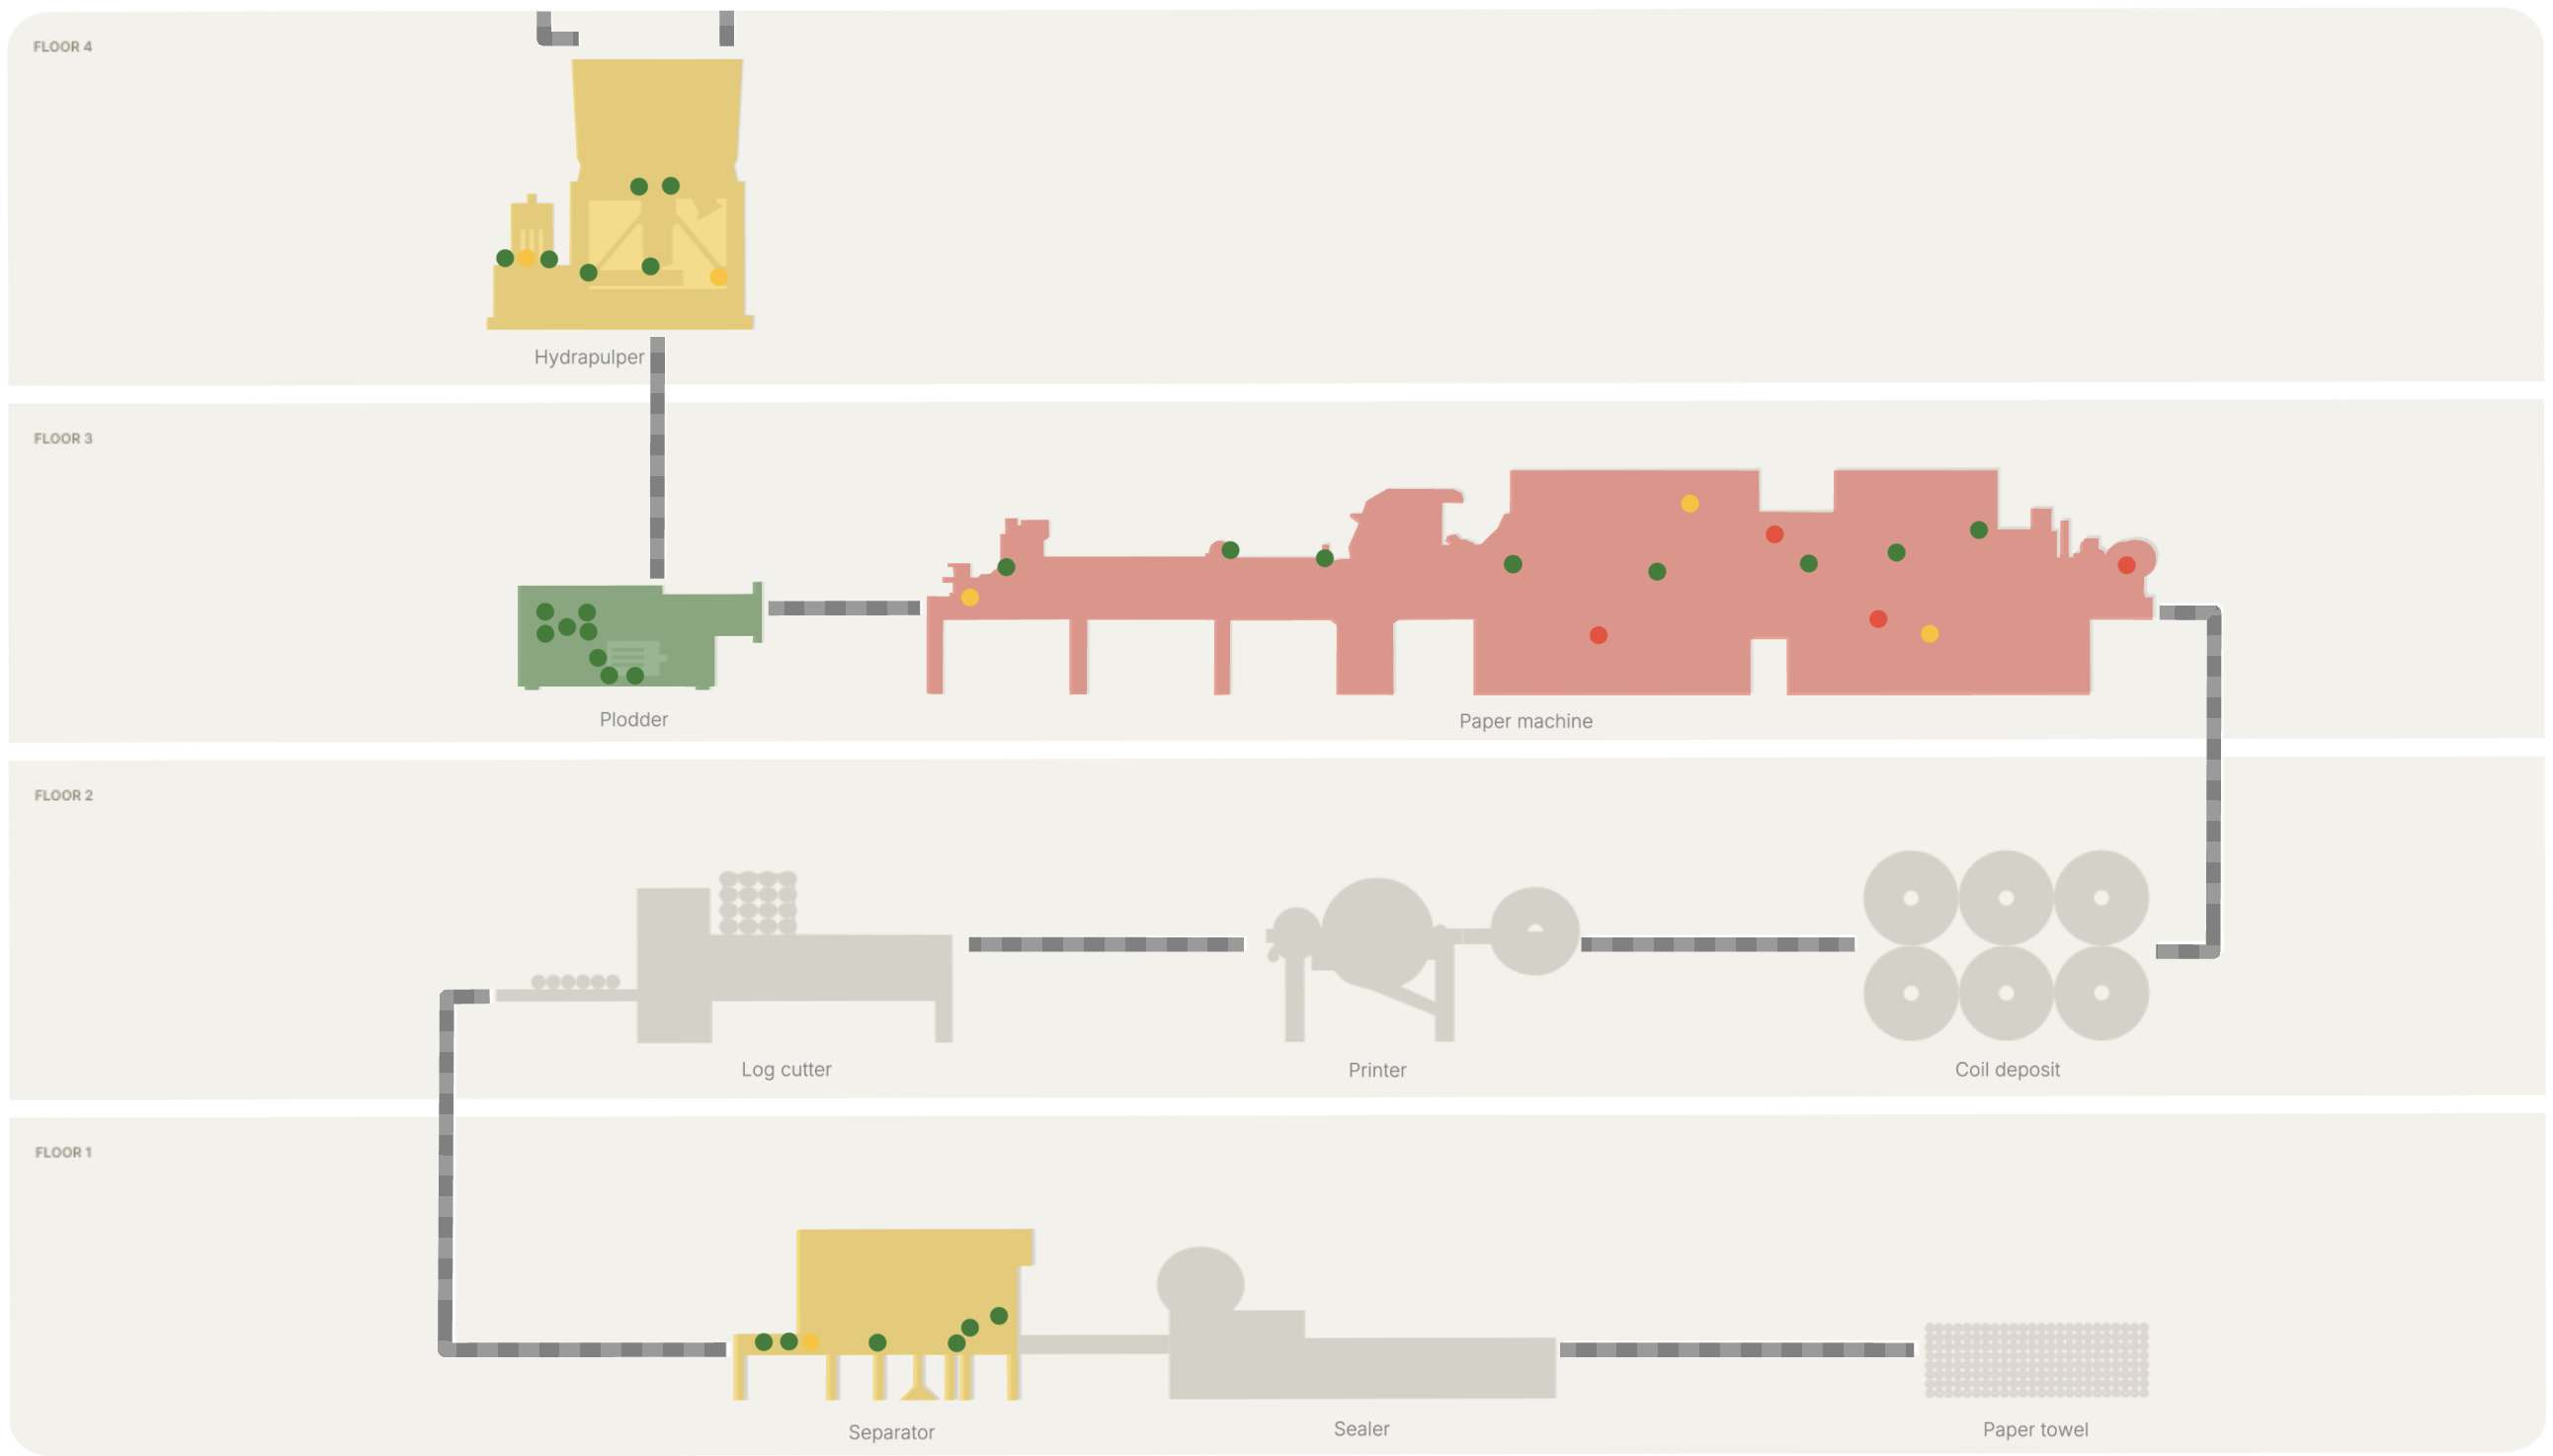
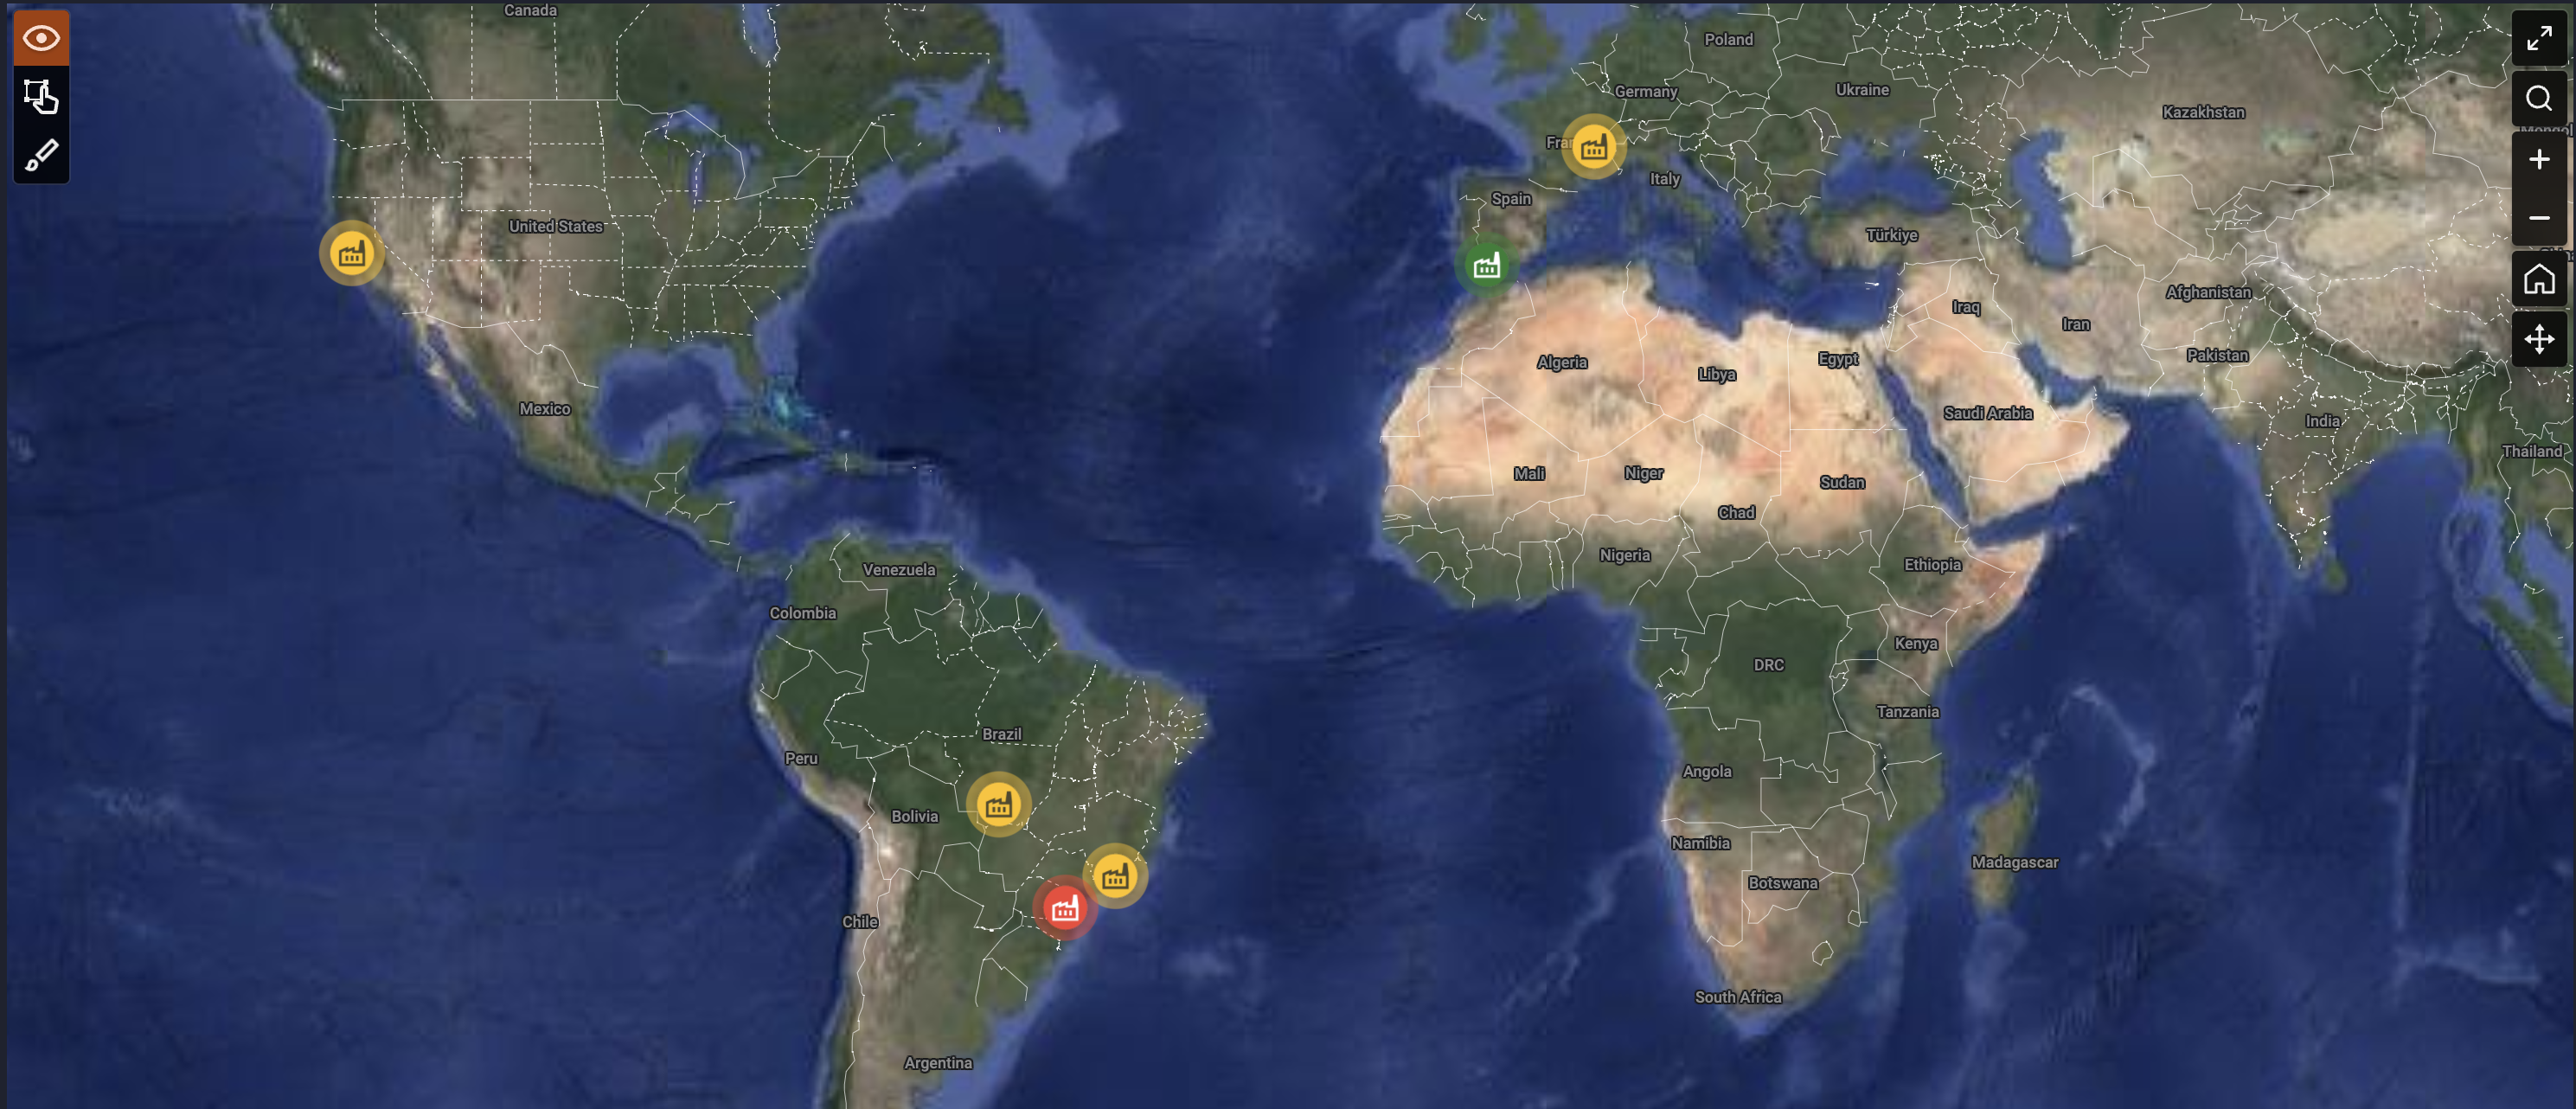
With dynamic interactive visualization of all your facilities, custom multi-level floor plans, 3D models of individual assets, real-time operating and IoT data, and more, Hopara helps you understand exactly where your issues are located and gives you the context to respond quickly.
Visualize Your IoT Data
Gain a complete view of your factory operations with interactive maps and dashboards.
Conduct In-Depth Analysis
Use advanced analytics to identify trends, patterns, and anomalies.
Predict Equipment Failures
Leverage predictive analytics to anticipate maintenance needs and avoid downtime
Optimize Resource Allocation
Make data-driven decisions to improve efficiency and resource utilization
Centralize, analyze, and scale your manufacturing data visualization with ease
-
Integrated real-time visualization
Remote or on-site, everyone works from a centralized view of the facility.
-
Customizable Interfaces
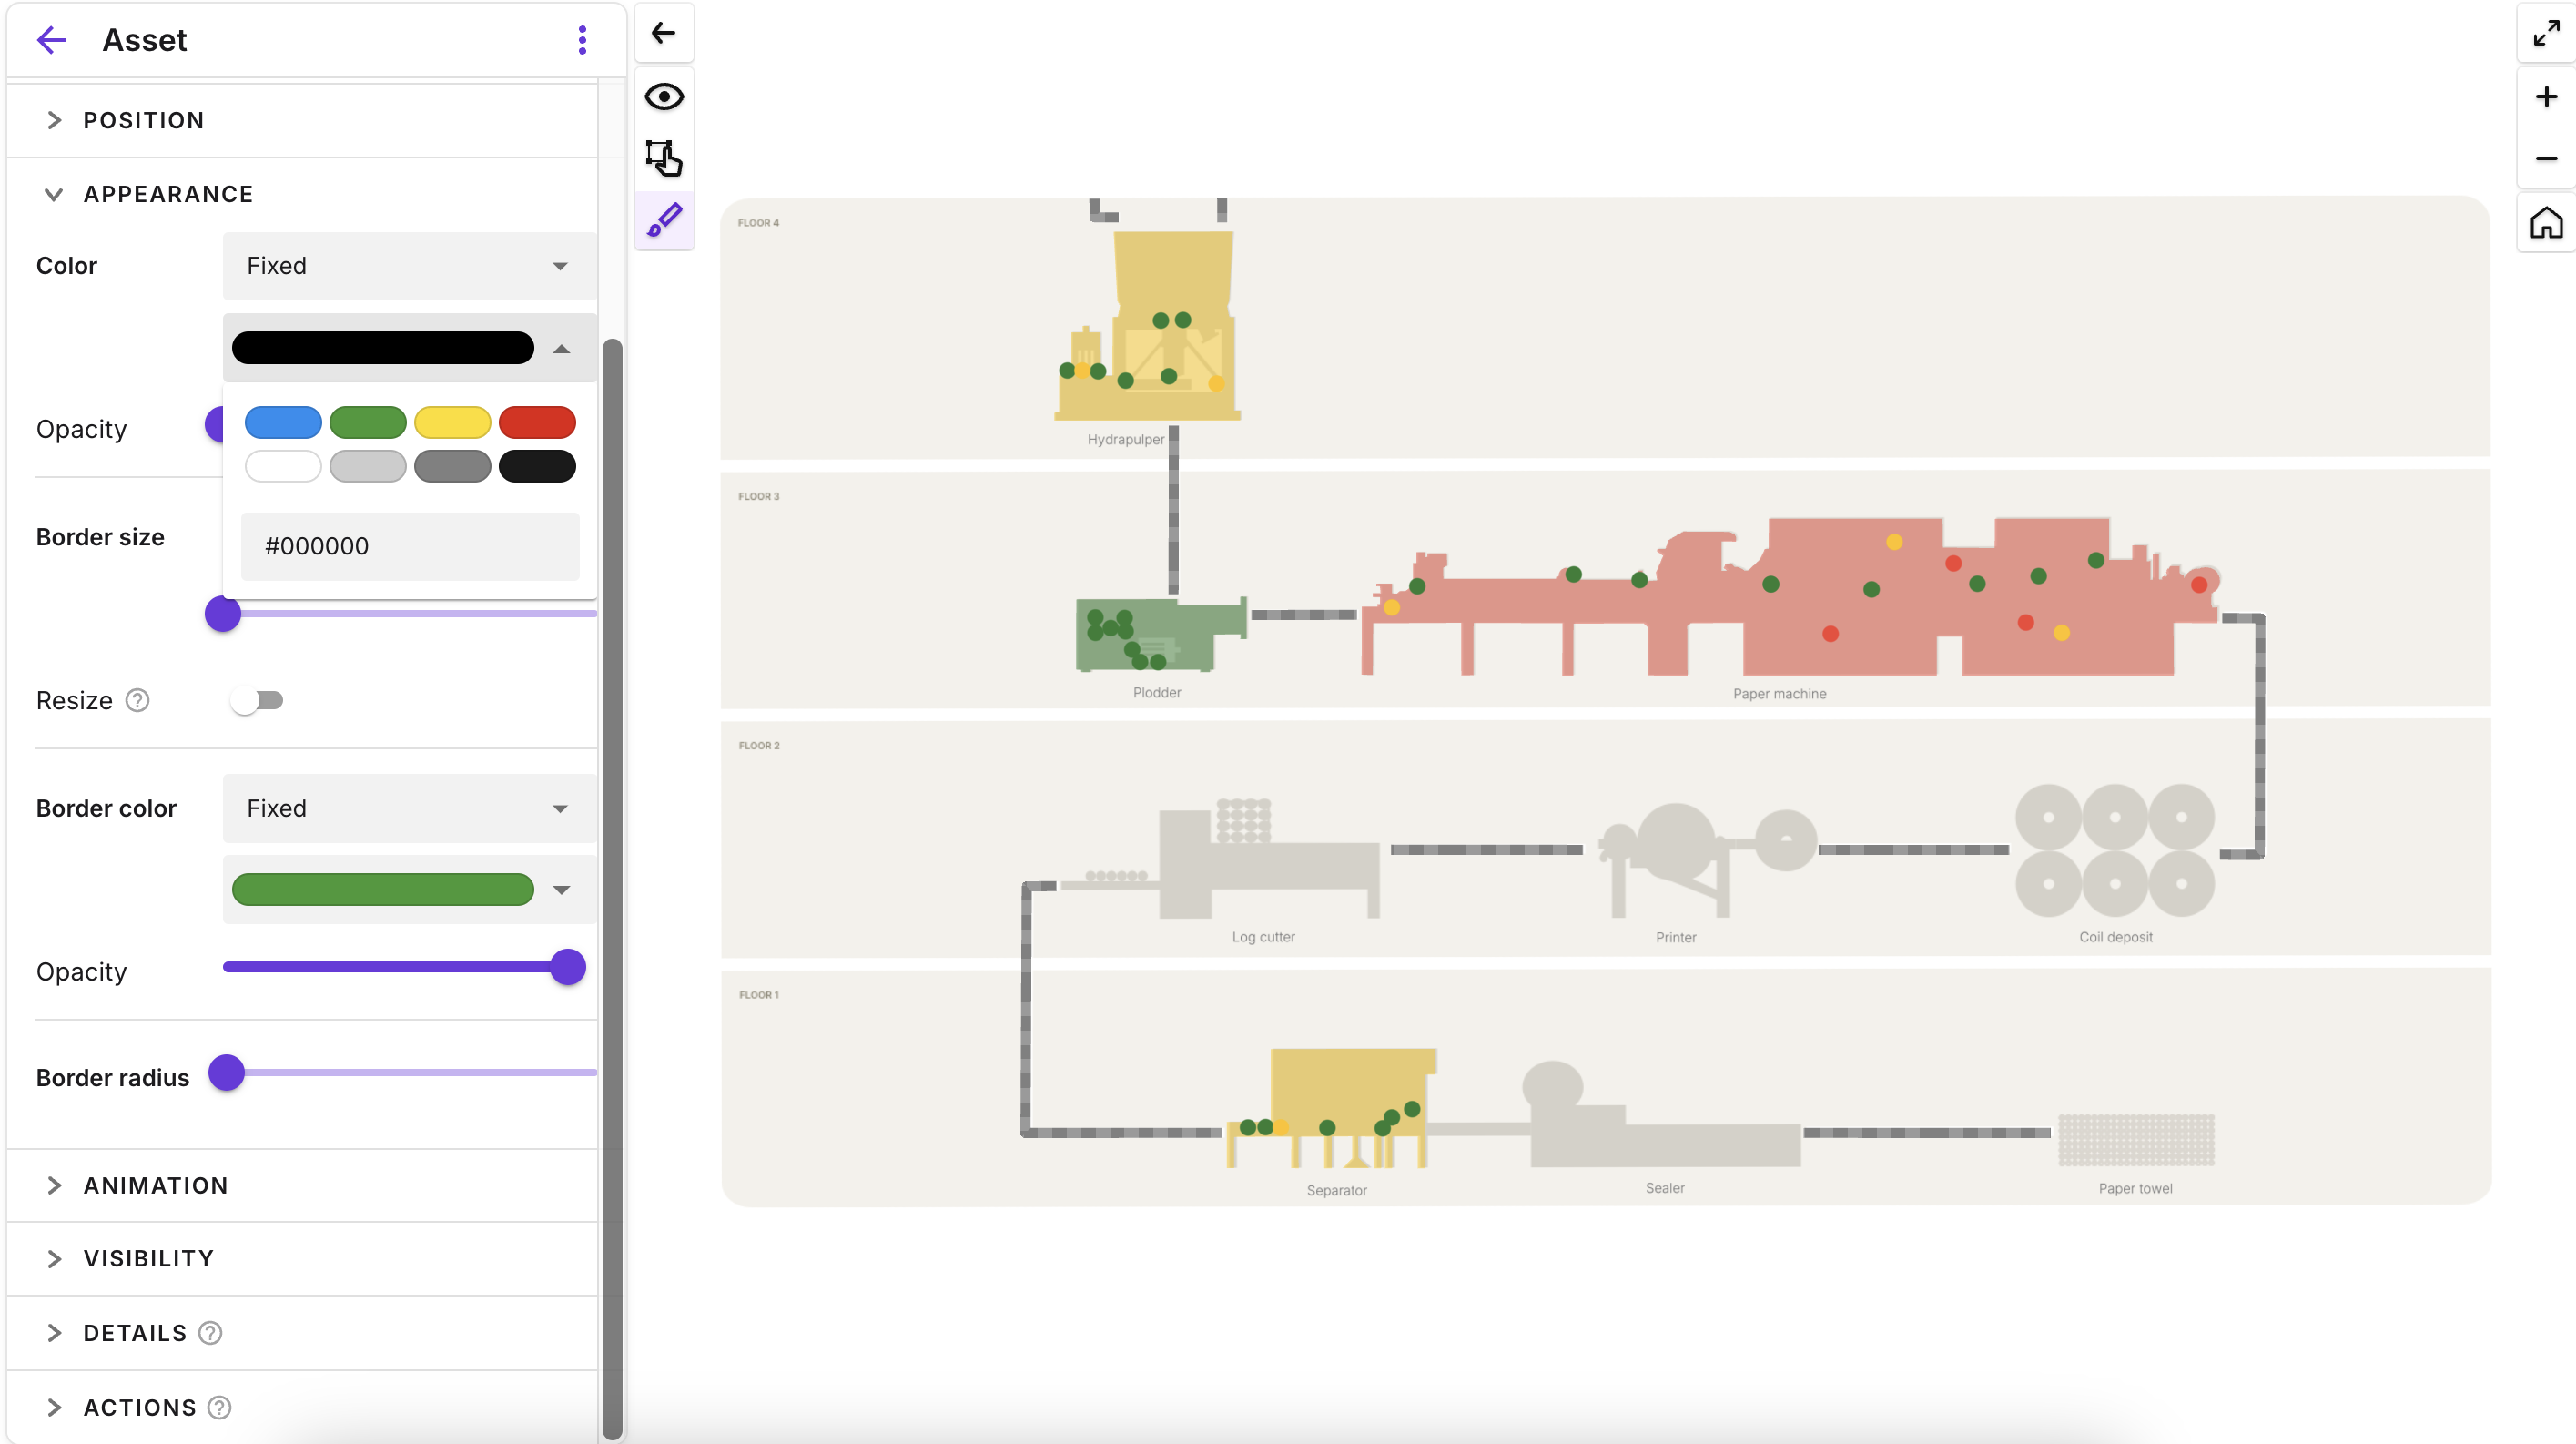
Create personalized interfaces to visualize your data according to your needs.
-
All in One Place
Connect Hopara with your existing infrastructure and data sources.
-
Real-Time Monitoring
Track the performance of your devices and sensors in real time.
-
Quality and Compliance Maintenance
Maintain quality, compliance, and certification requirements.
-
Scalability
Manage big data and expand your deployment as needed.


