Grafana Alternatives:
Learn Why Hopara Is a Better Choice for Real-time Data Visualization
Hopara is a powerful tool that transforms complex data into real-time, interactive, and actionable insights.
Why Hopara as Grafana Alternative?

Enhanced Contextual Visualization
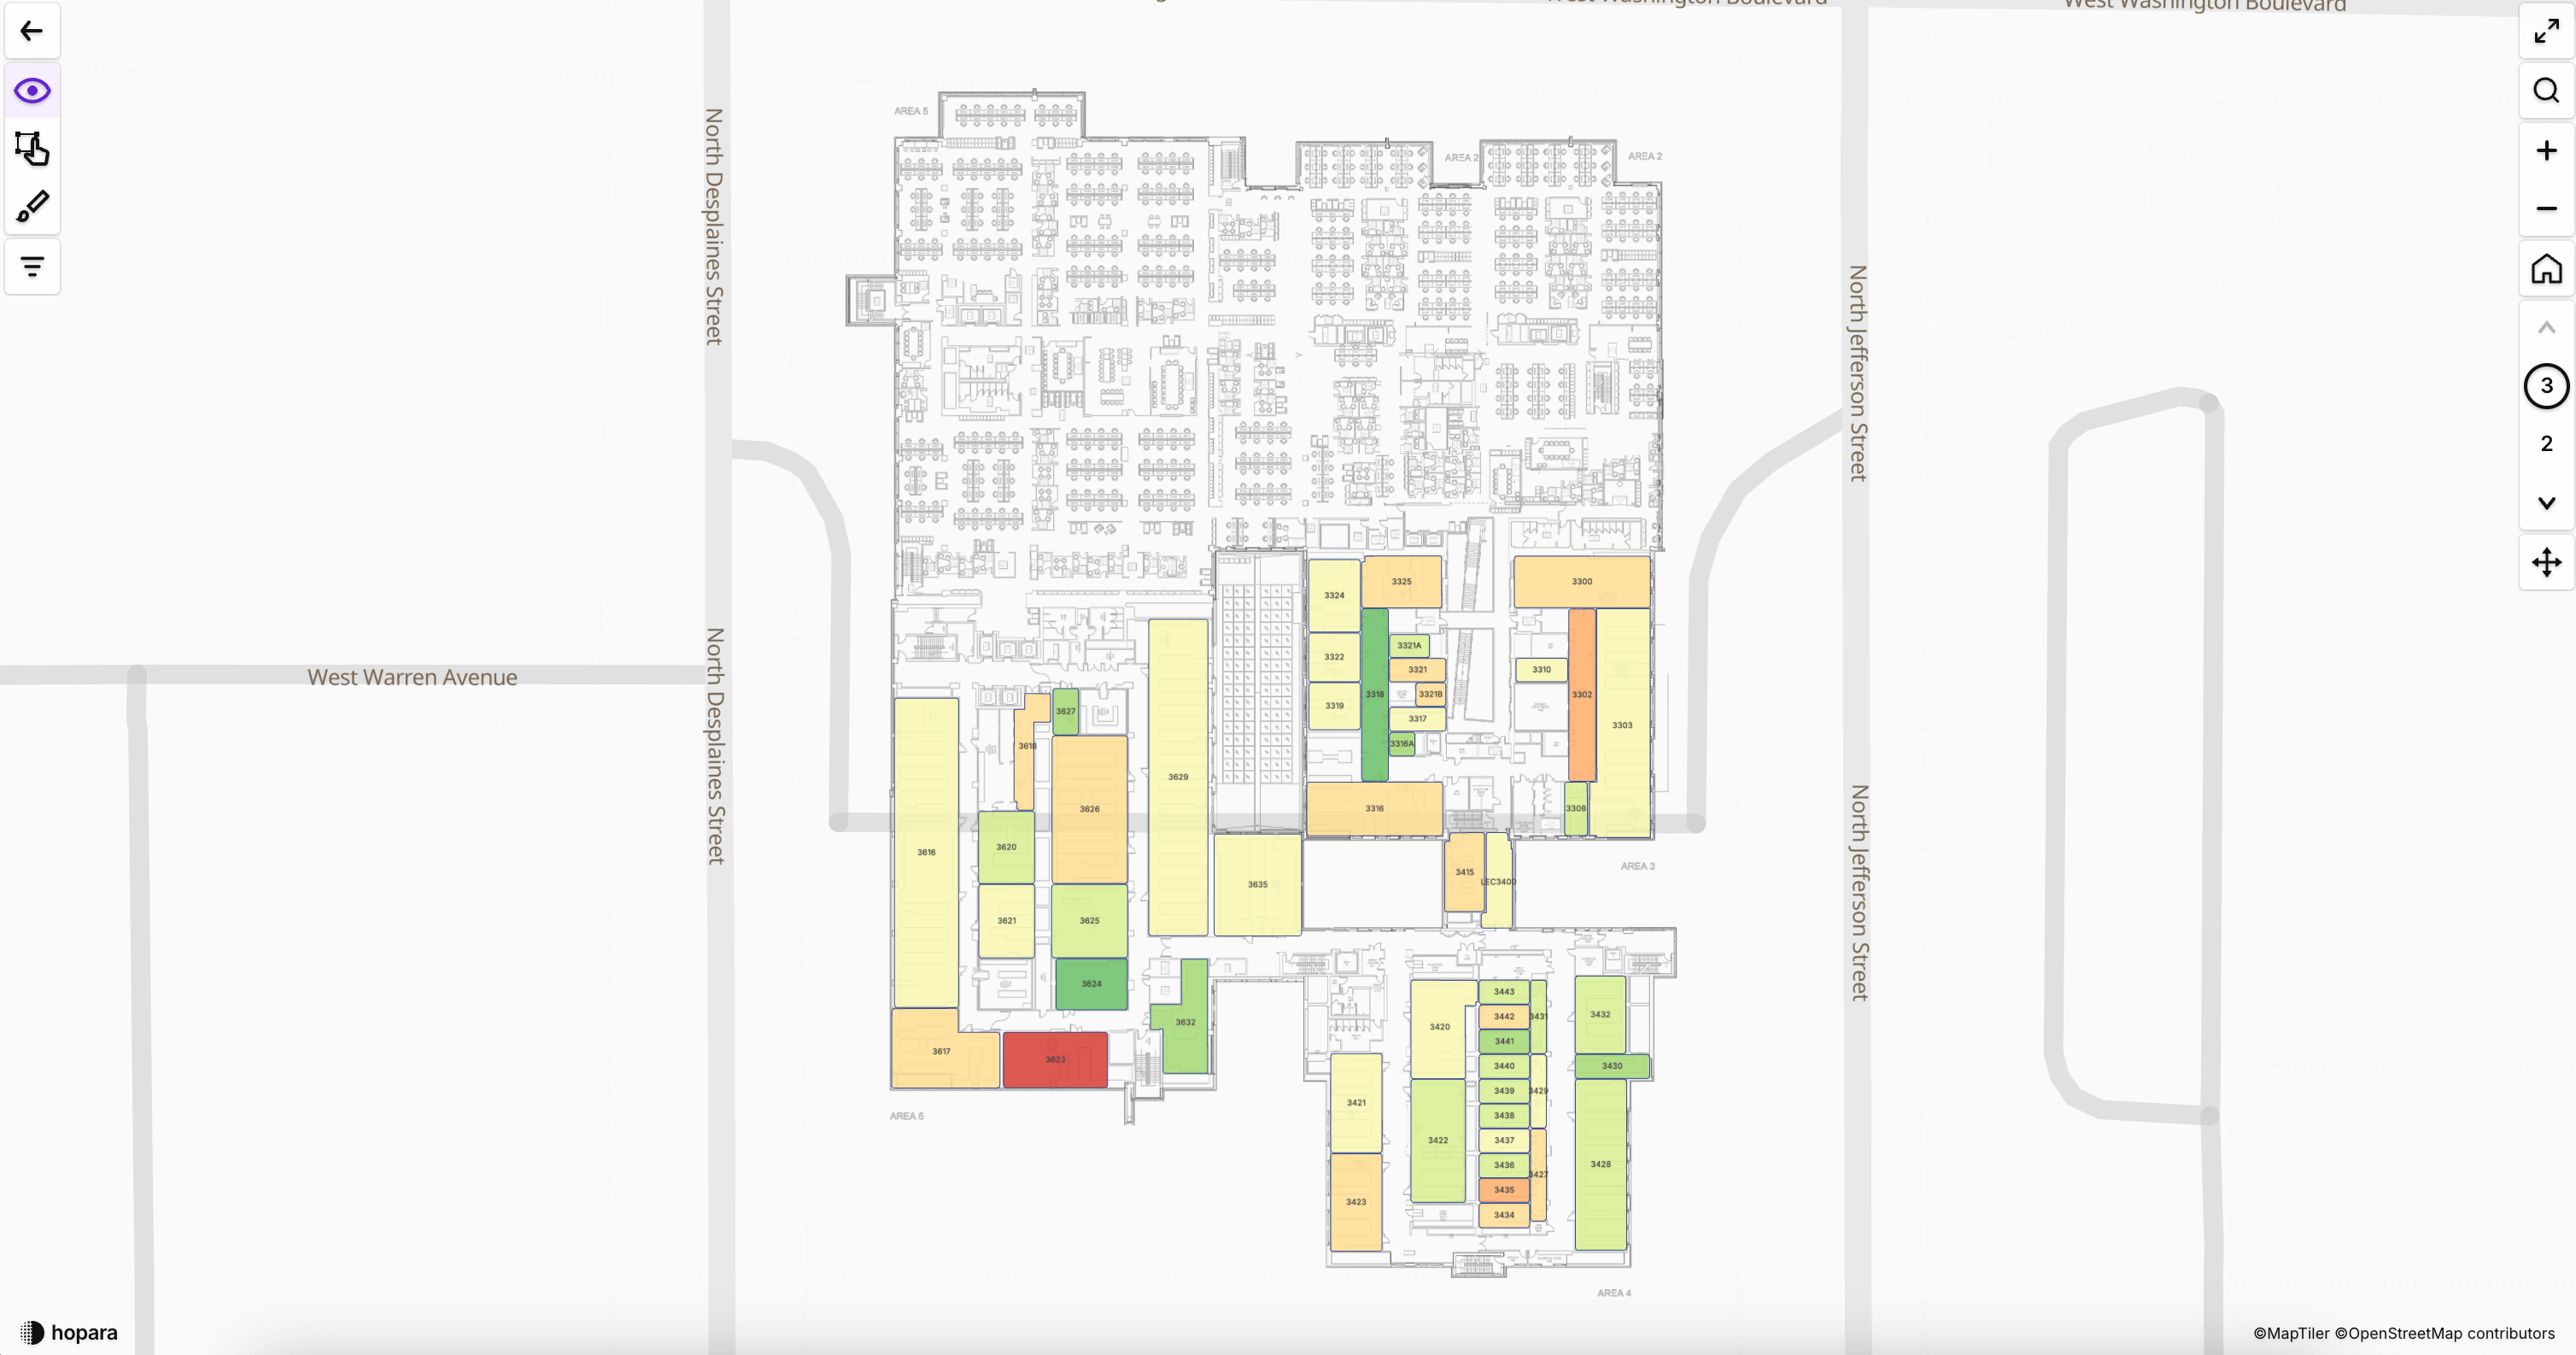
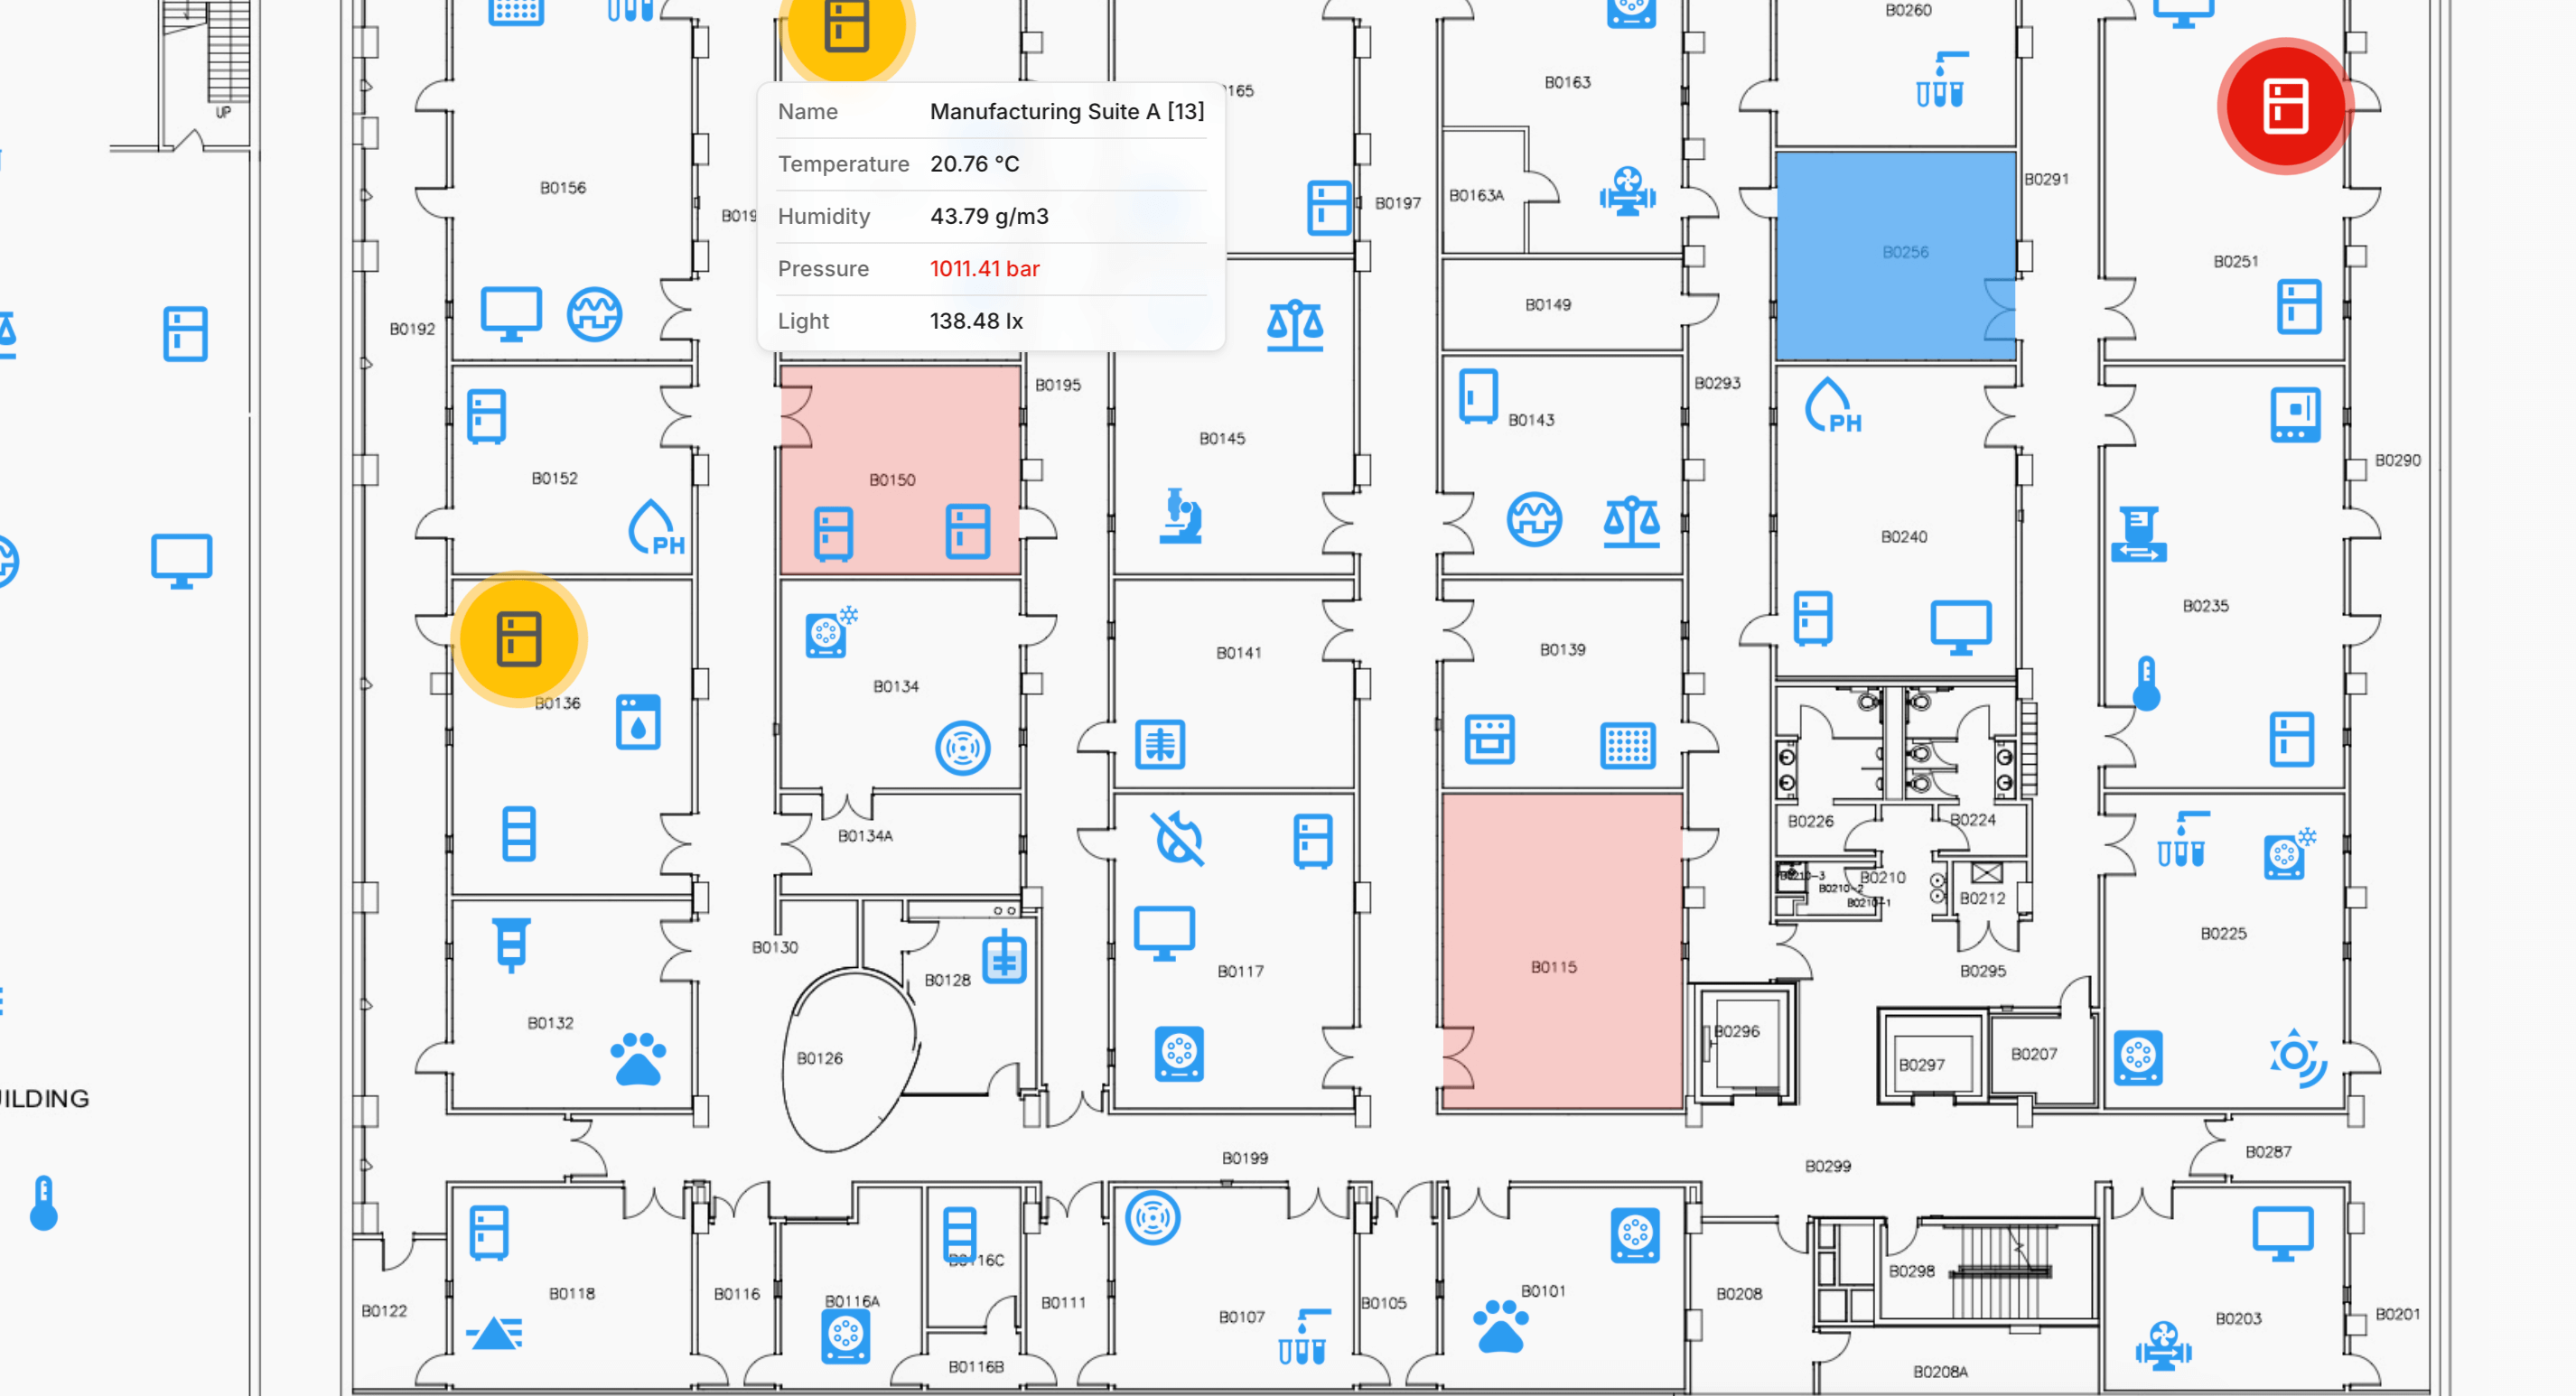
Add relevant context such as floor plans, technical drawings, maps, and 3D models.
Make visualizations easier to understand and react to.
Efficient Asset Management
Automatically place assets using location data or simply drag and drop them into place.
Manage large numbers of assets without manual placement hassles.
Semantic Zoom Capability
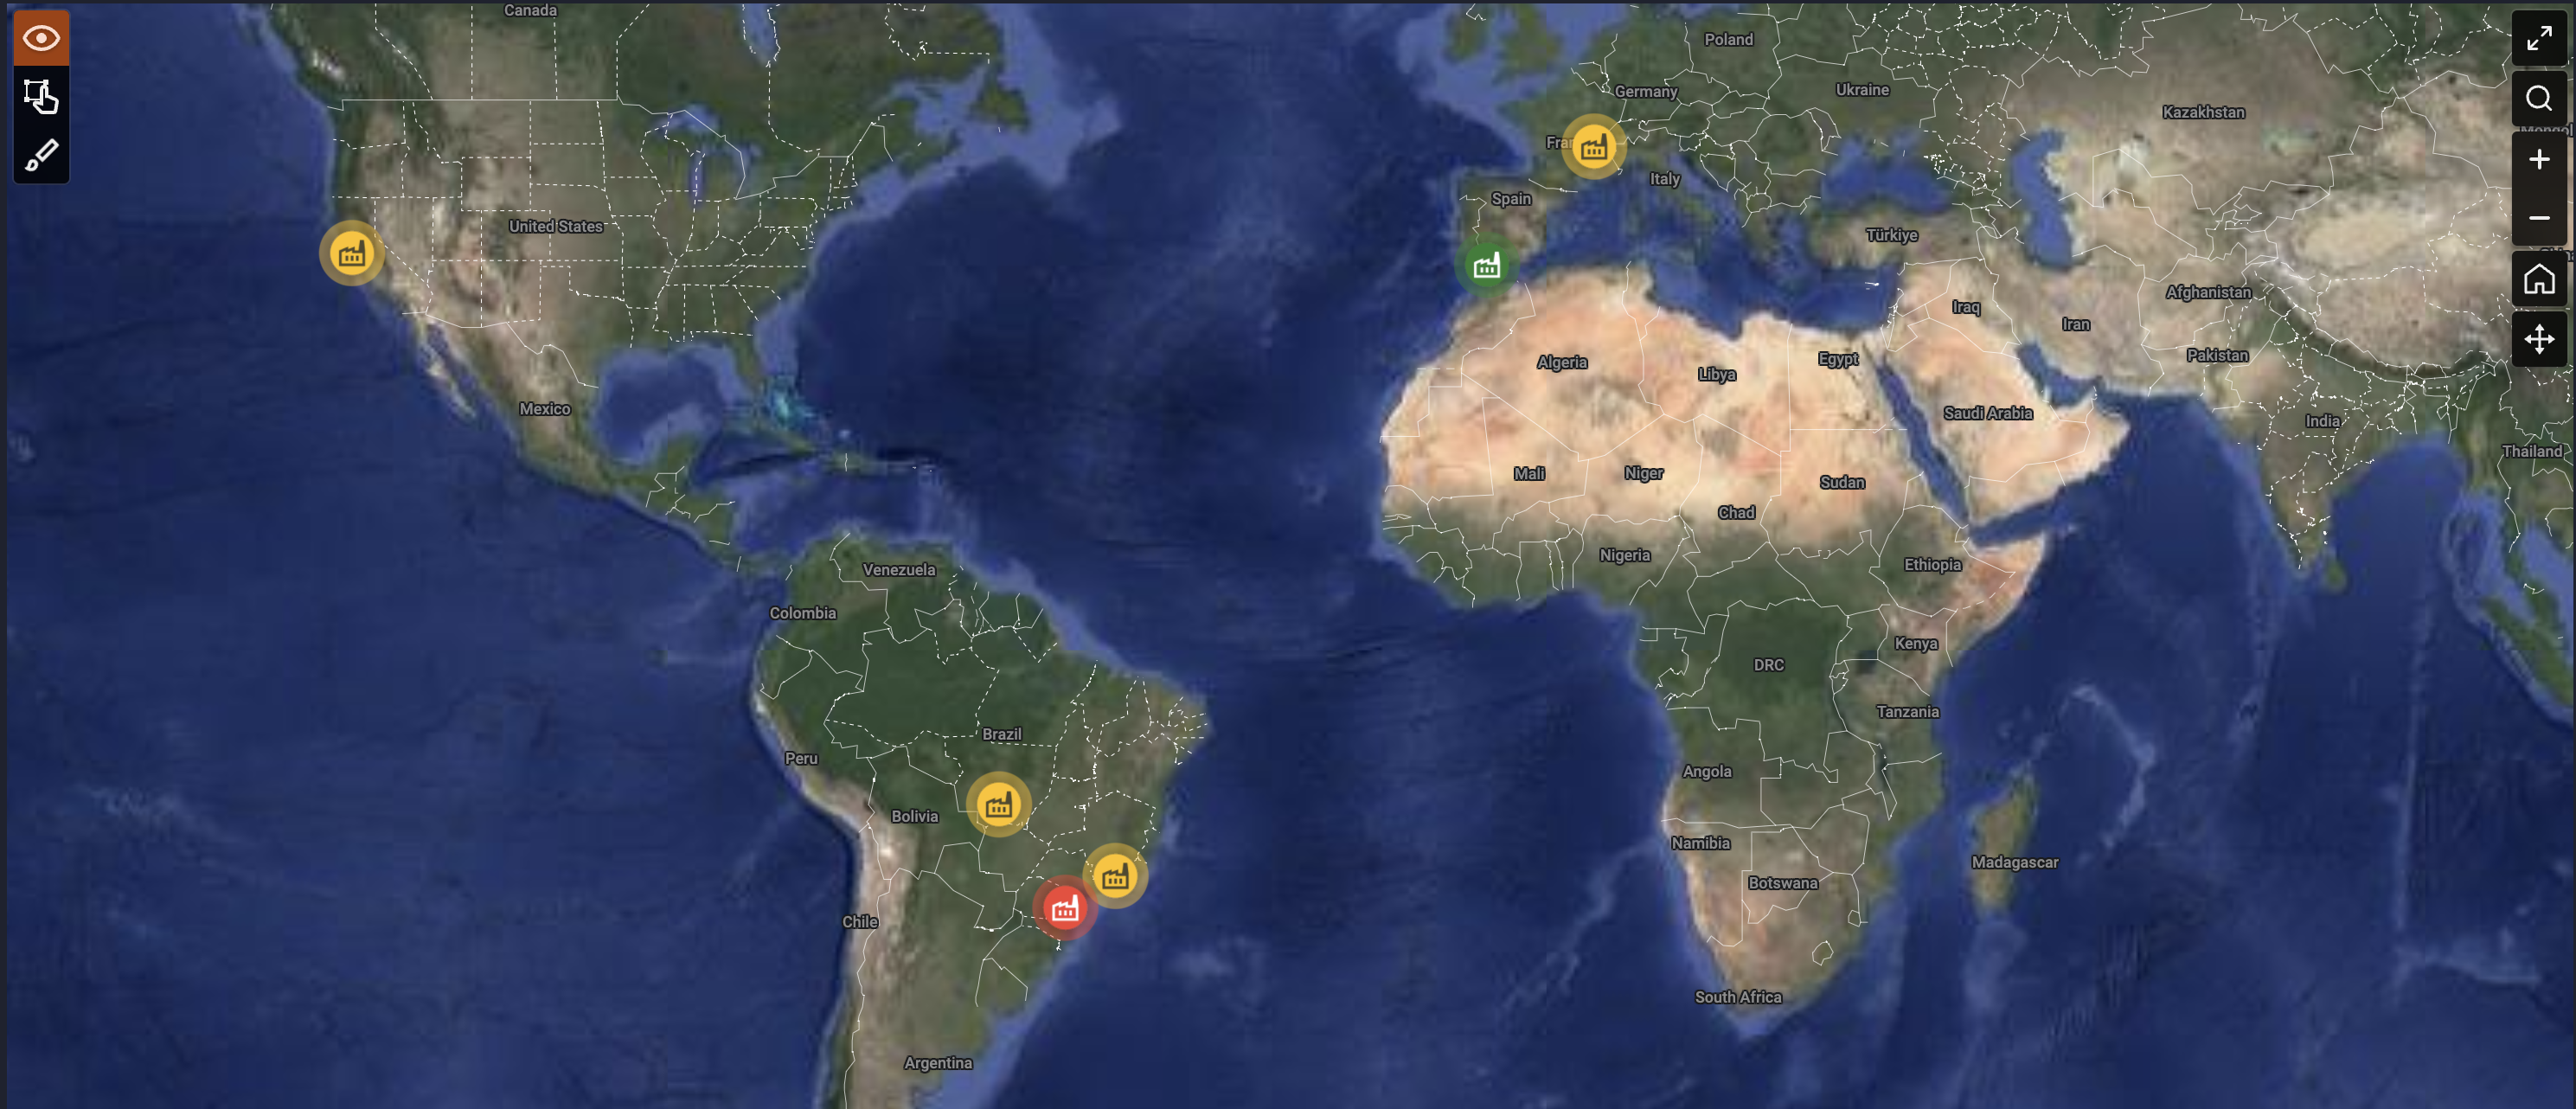
Effortlessly navigate between different levels of detail. Hopara’s unique semantic zoom allows you to see both the overview and granular details seamlessly.
Customizable Dashboards
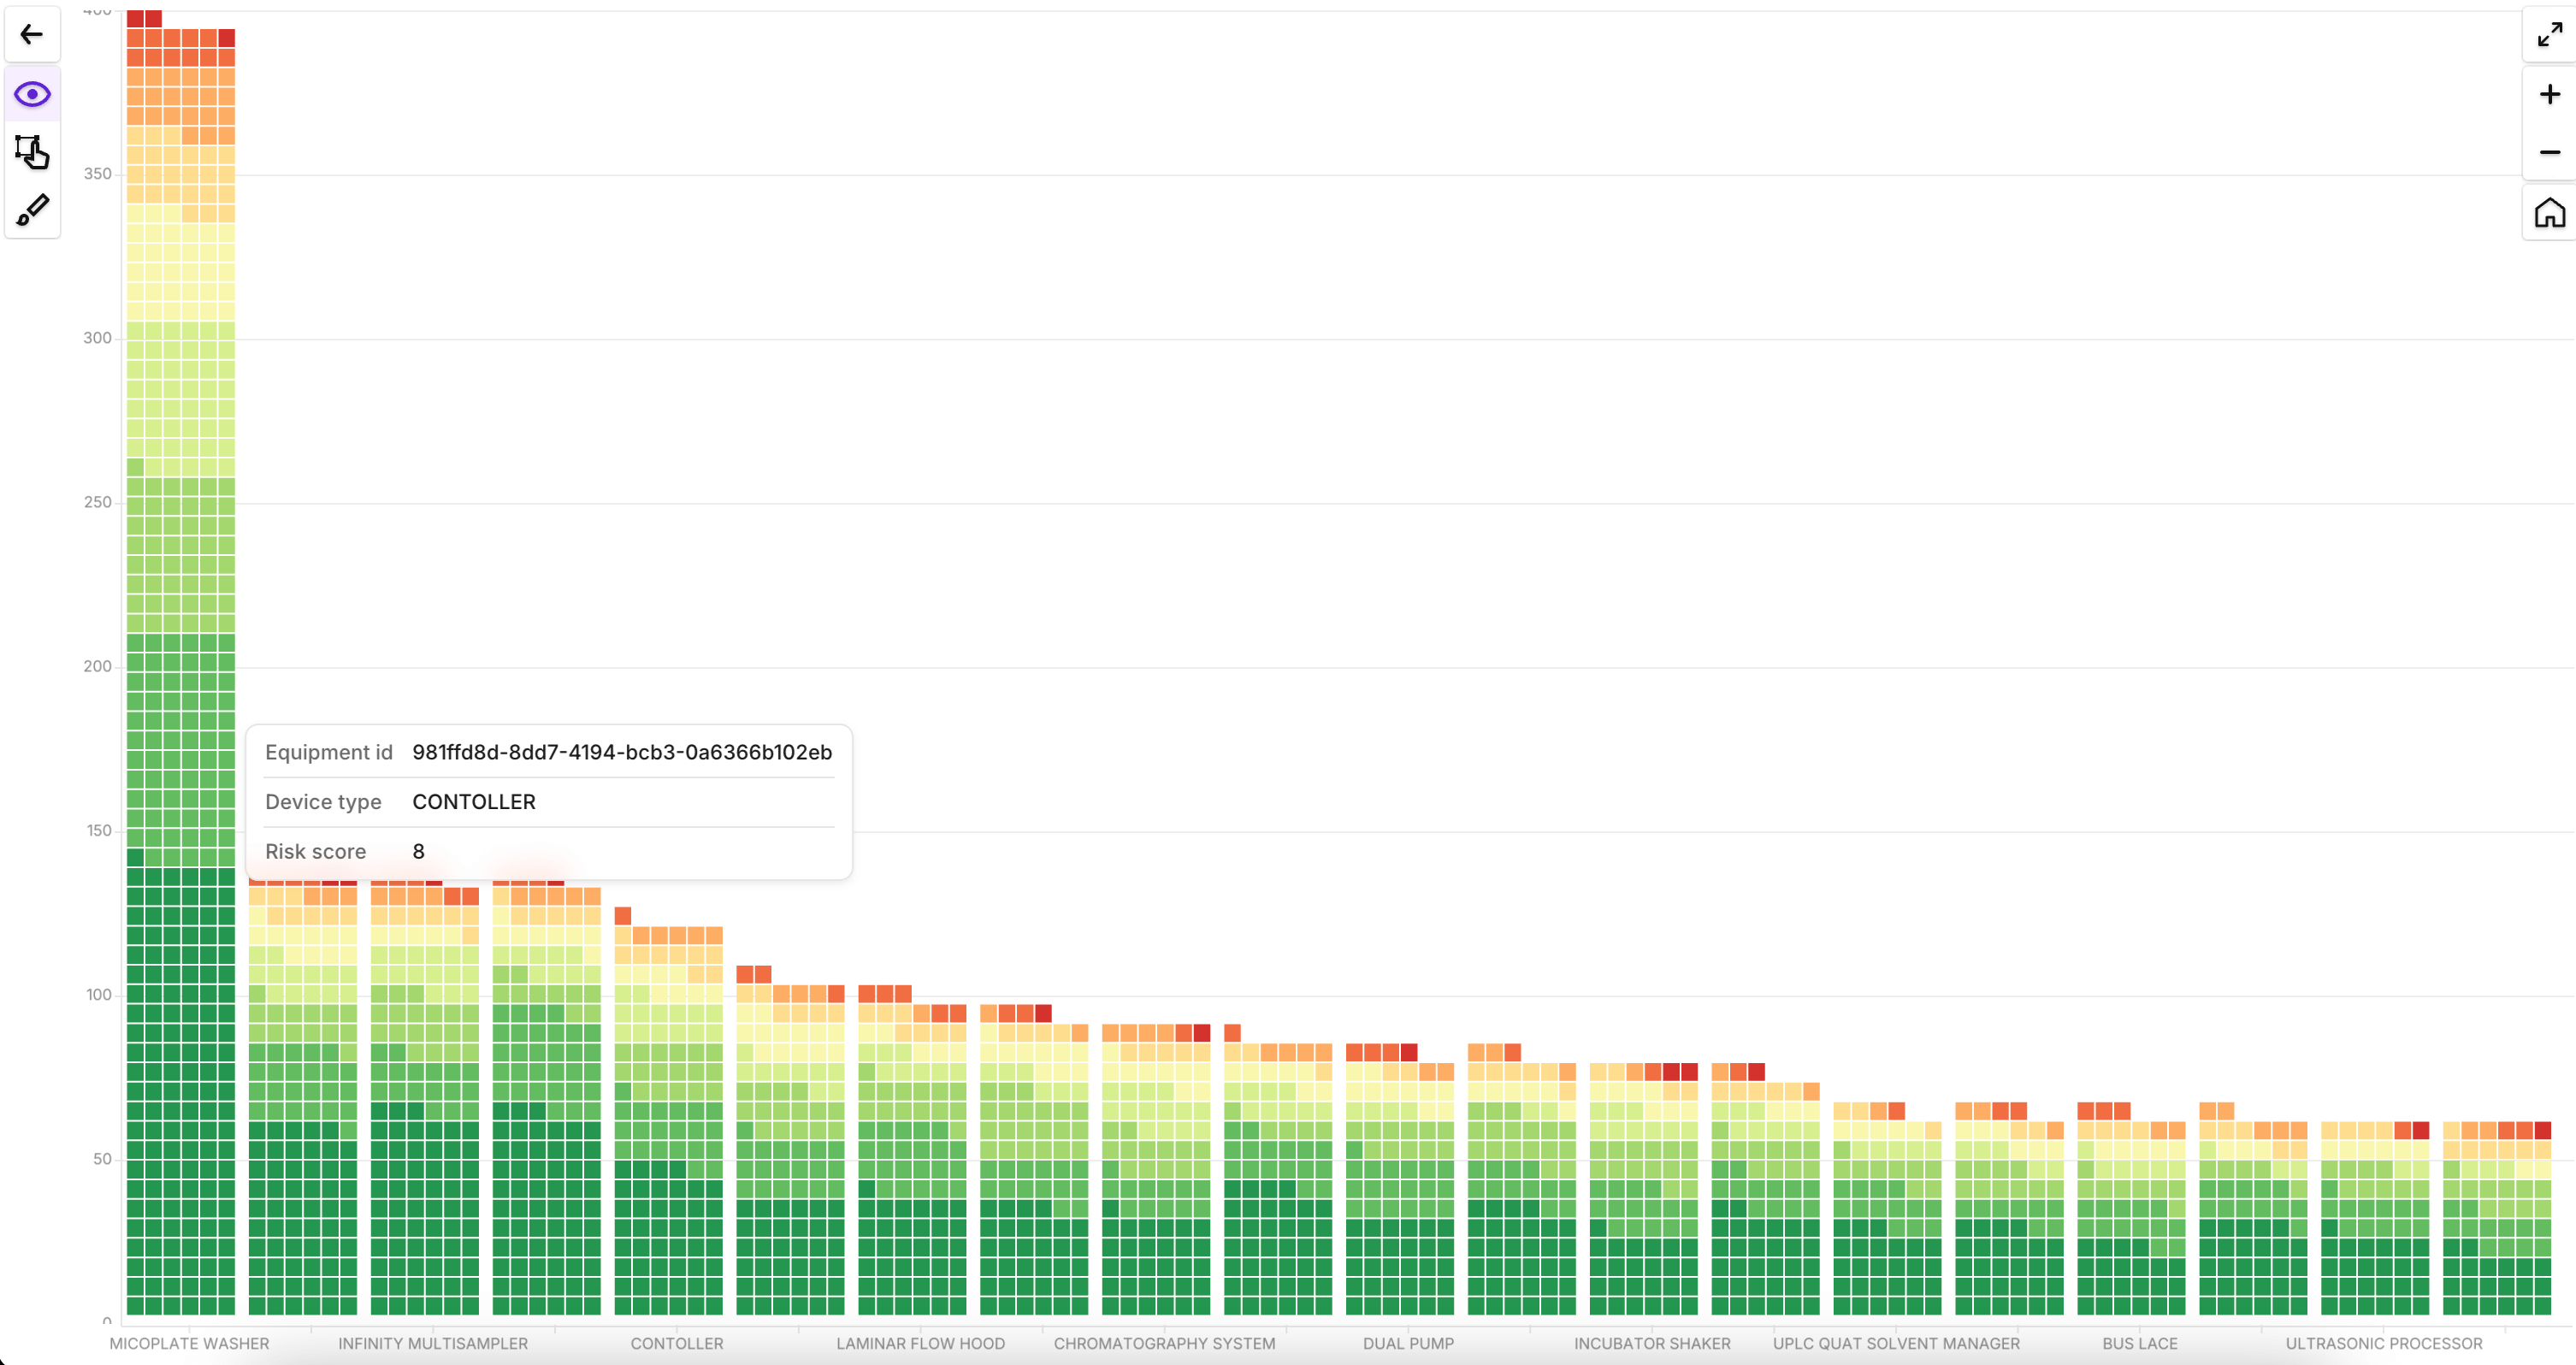
Design visualizations exactly how you’d like to see them. Create a real single pane of glass or bird’s-eye view of your operations.
Use data for your strategic advantage, more efficiently than ever before
| Features |
|
 |
| Custom Floor Plan Uploads | ||
| Animated Icons and Visual Elements | ||
| Semantic Zoom Capability | ||
| Efficient Asset Management (500+ assets) | ||
| Proportional Zoom | ||
| Single Pane of Glass View | ||
| Optimized for mobile screens | ||
| Flexibility in Design |
Limited
|
|
| Contextual Information Integration |
Limited
|
|
| Performance at Scale |
May be slow
|
|
| Real-Time Visualization |
Yes
|


How Hopara Works?
-
1.
Connect Your Data
Seamlessly integrate data from IoT devices, sensors, and databases.
-
2.
Build Layers and Custom Views
Use layers to visualize complex data sets in a simple, easy-to-navigate interface.
-
3.
Share Insights
Collaborate with your team using interactive dashboards and shareable links.
Frequently Asked Questions
Why should I consider Grafana alternatives like Hopara?
Grafana is a powerful tool for time-series data, but it lacks customization options like real-time floor plan uploads, animated icons, and semantic zoom capabilities. Hopara, as a Grafana alternative, offers a more intuitive and flexible interface, making it ideal for users who need greater control over their visualizations.
How does Hopara compare to Grafana in terms of real-time data visualization?
While both platforms provide real-time visualization capabilities, Hopara excels with its ability to integrate context-rich elements like 3D models and technical drawings, making it easier to interpret complex data. These advanced features make Hopara a top choice among Grafana alternatives.
What makes Hopara a better alternative to Grafana for asset management?
Hopara simplifies the process of managing assets by allowing automatic placement and real-time tracking. Unlike Grafana, which requires manual placement and lacks proportional zoom, Hopara’s features help users manage large numbers of assets with ease.
Is Hopara as customizable as Grafana?
Hopara offers a higher level of customization compared to Grafana, including the ability to design unique visualizations, add animations, and create a true single pane of glass view. This flexibility makes Hopara one of the best Grafana alternatives for advanced users.
How does Hopara handle large-scale data visualization better than Grafana?
Hopara’s architecture is designed for high performance, even when managing thousands of data points. Its lightning-fast processing ensures that users can visualize and interact with their data without experiencing the slowdowns that some users encounter with Grafana.
