Application of Real-Time Data Visualization
to Digital Twins
Organizations generate enormous amounts of data from IoT devices, enterprise systems, and real-time streaming platforms. But without the right technology to analyze it, this data remains fragmented and underutilized.
Hopara solves this with an immersive platform that turns complex data into clear, visual models supporting your Digital Twin initiative or on a stand-alone basis.

An Integrated View
Of all your data, Real Time, and Interactive

2D/3D Models and Dashboards
Out of the box. No coding needed

Detect Anomalies and Receive Alerts
Before they become problems

Drive Process Optimization
By identifying bottlenecks and inefficiencies
-
Real-Time Data Out of the Box
Connect to IoT, Snowflake, Kafka, ServiceNow , Confluent ,databases, and more.
-
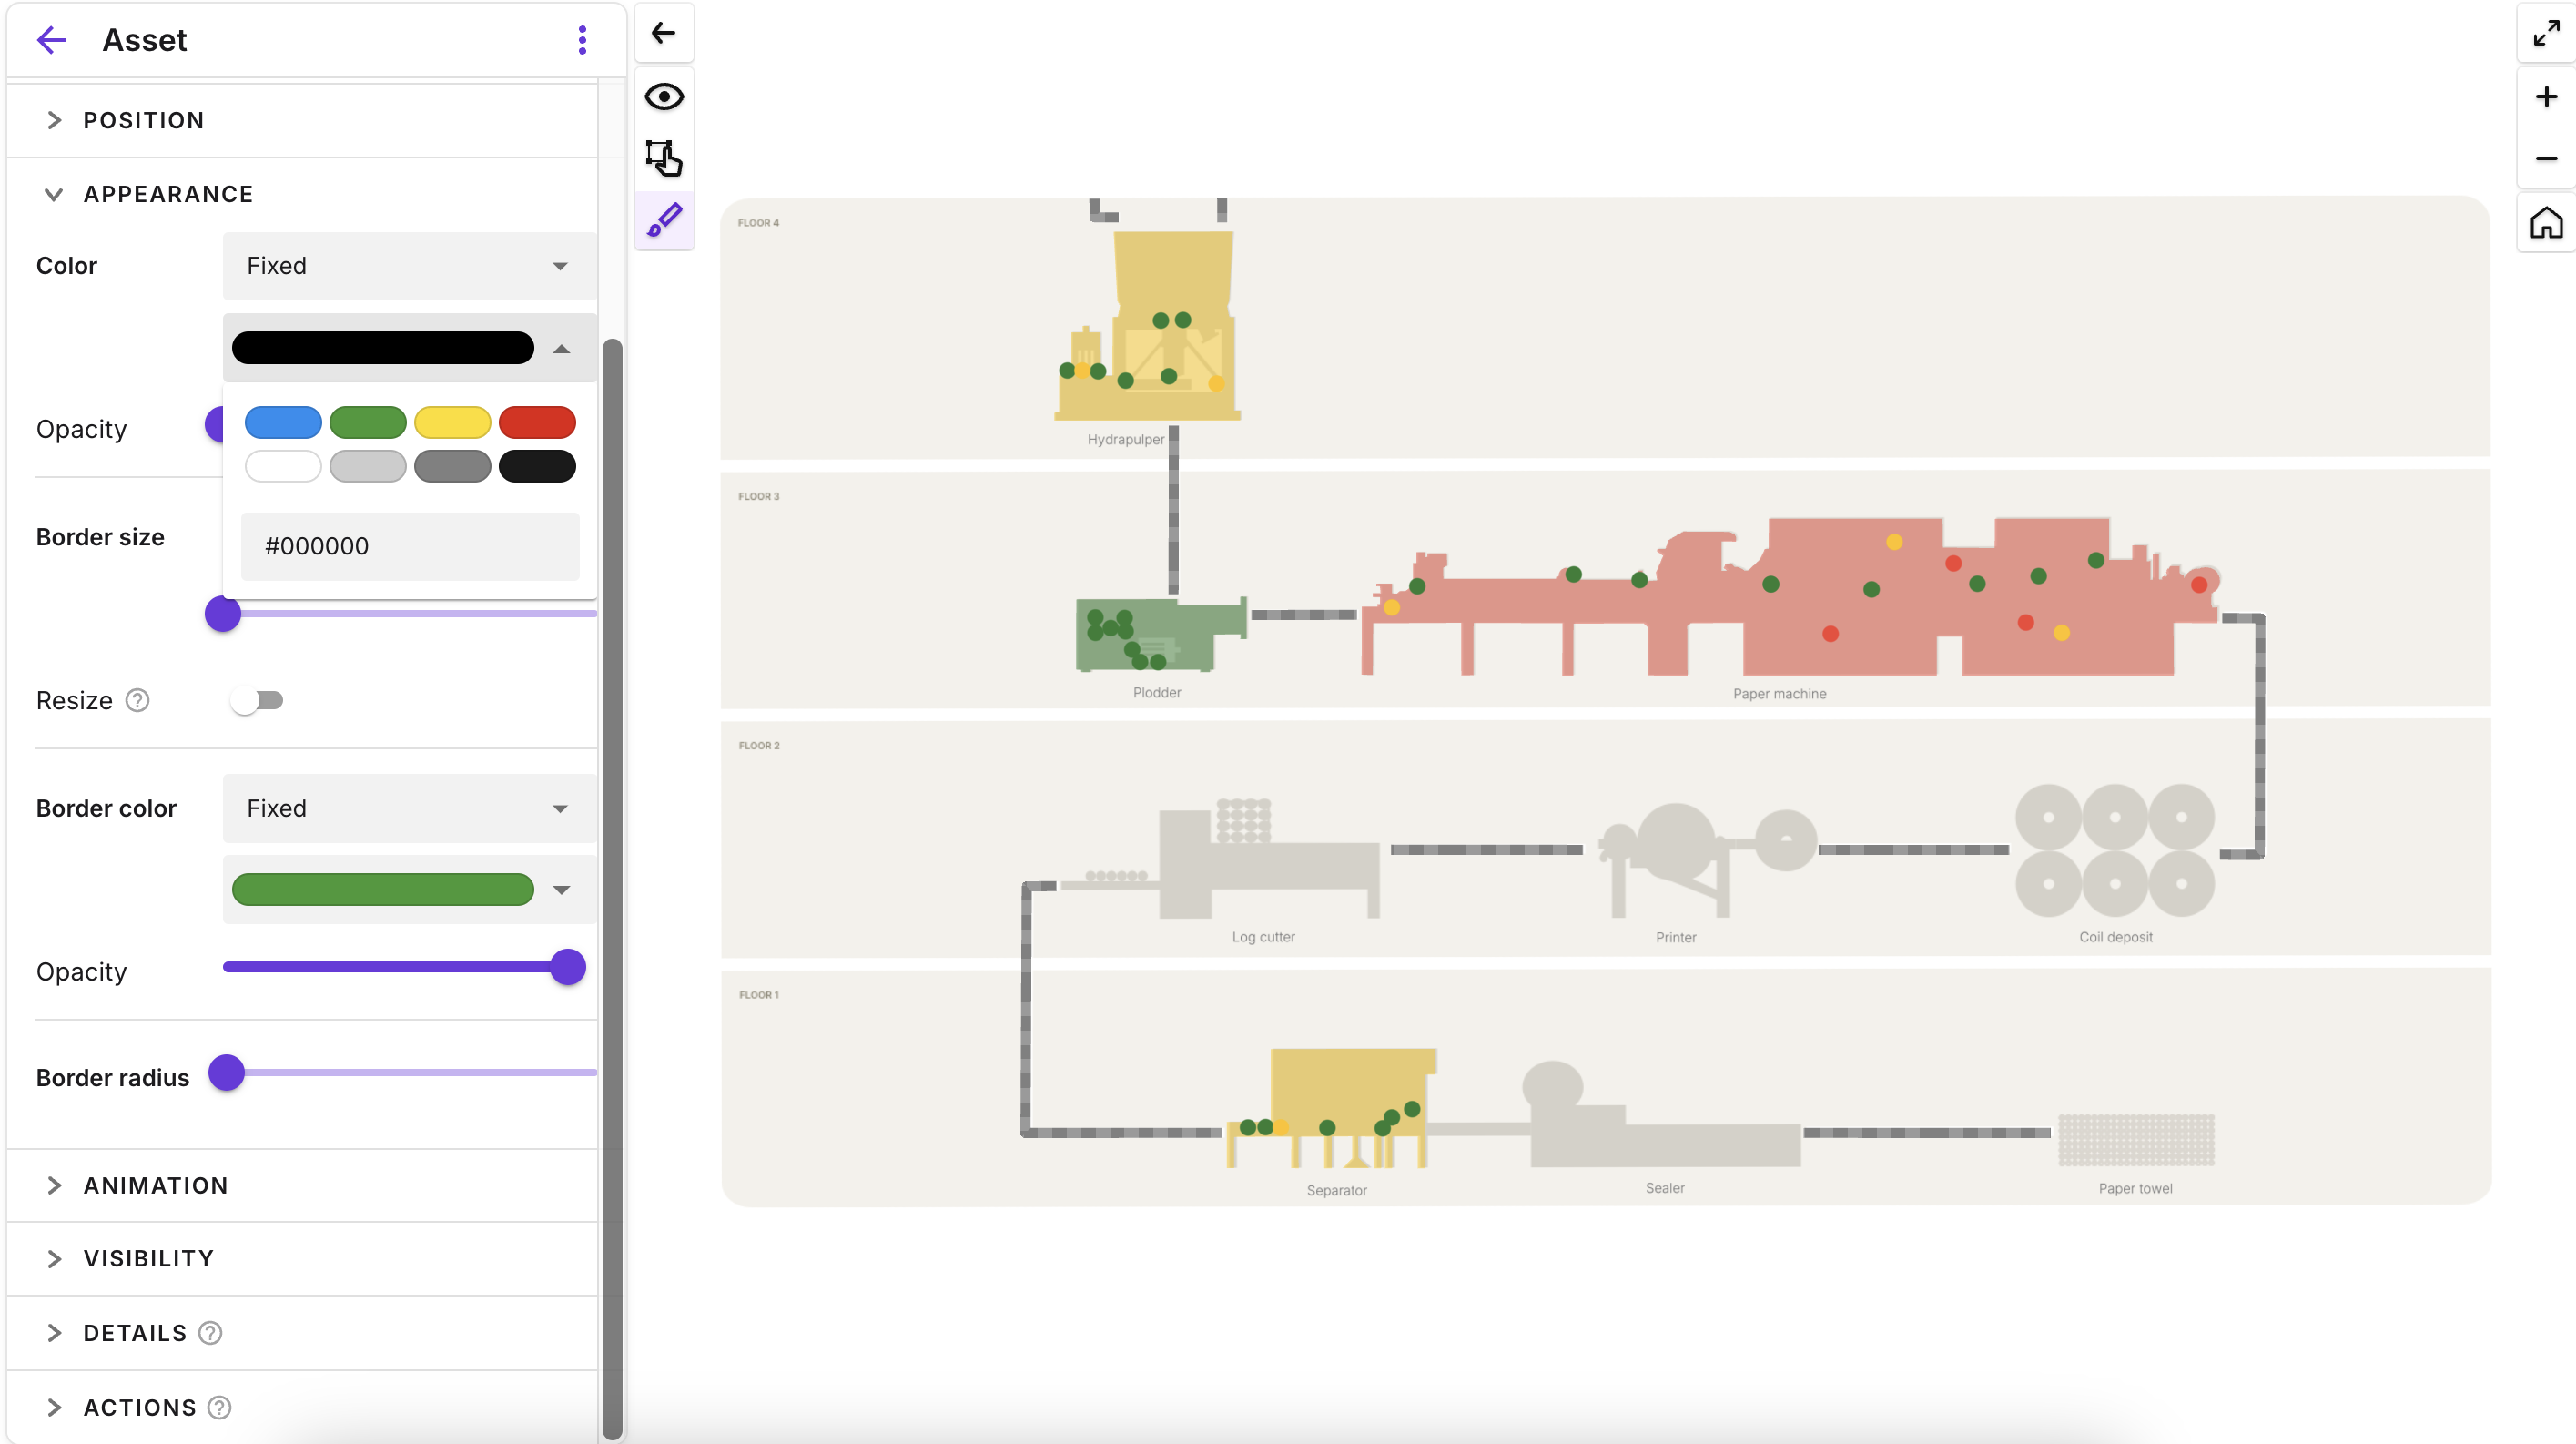
3D Visualizations
Create dynamic maps, dashboards, and 3D digital twins.
-
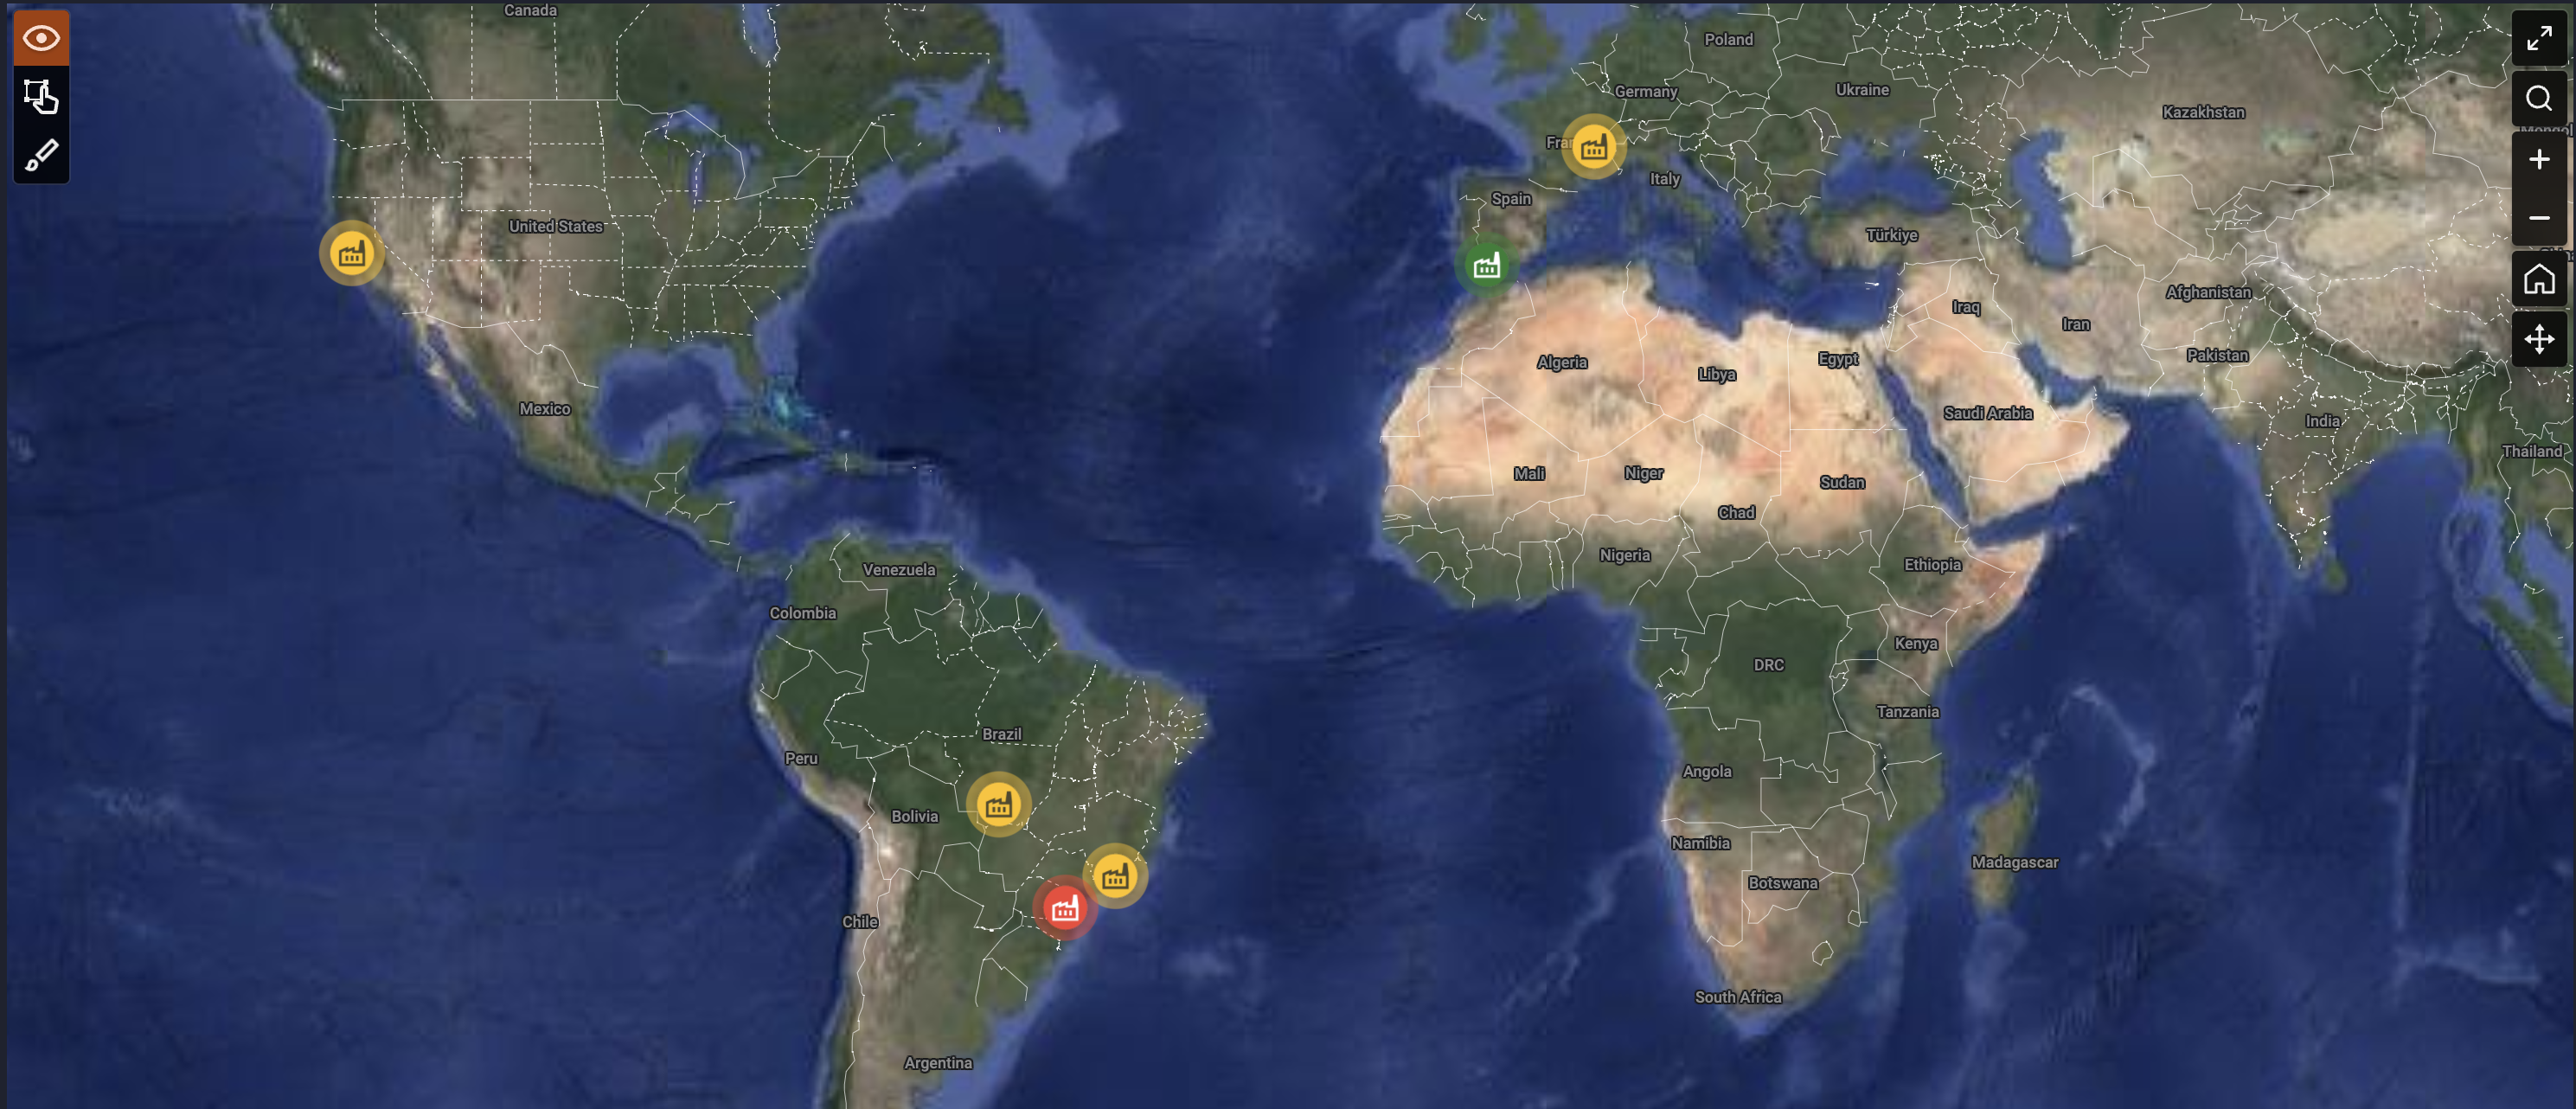
Geospatial Intelligence
Visualize spatial patterns and relationships across locations with a Google Map like user interface.
-
Smart Alerts & Notifications
Stay ahead of issues with real-time alerts.
-
Secure & Scalable
Enterprise-grade access control and infrastructure.
-
Open API & Seamless Integration
Custom integrations into your tech stack - ERP, MES, CRM, and beyond.
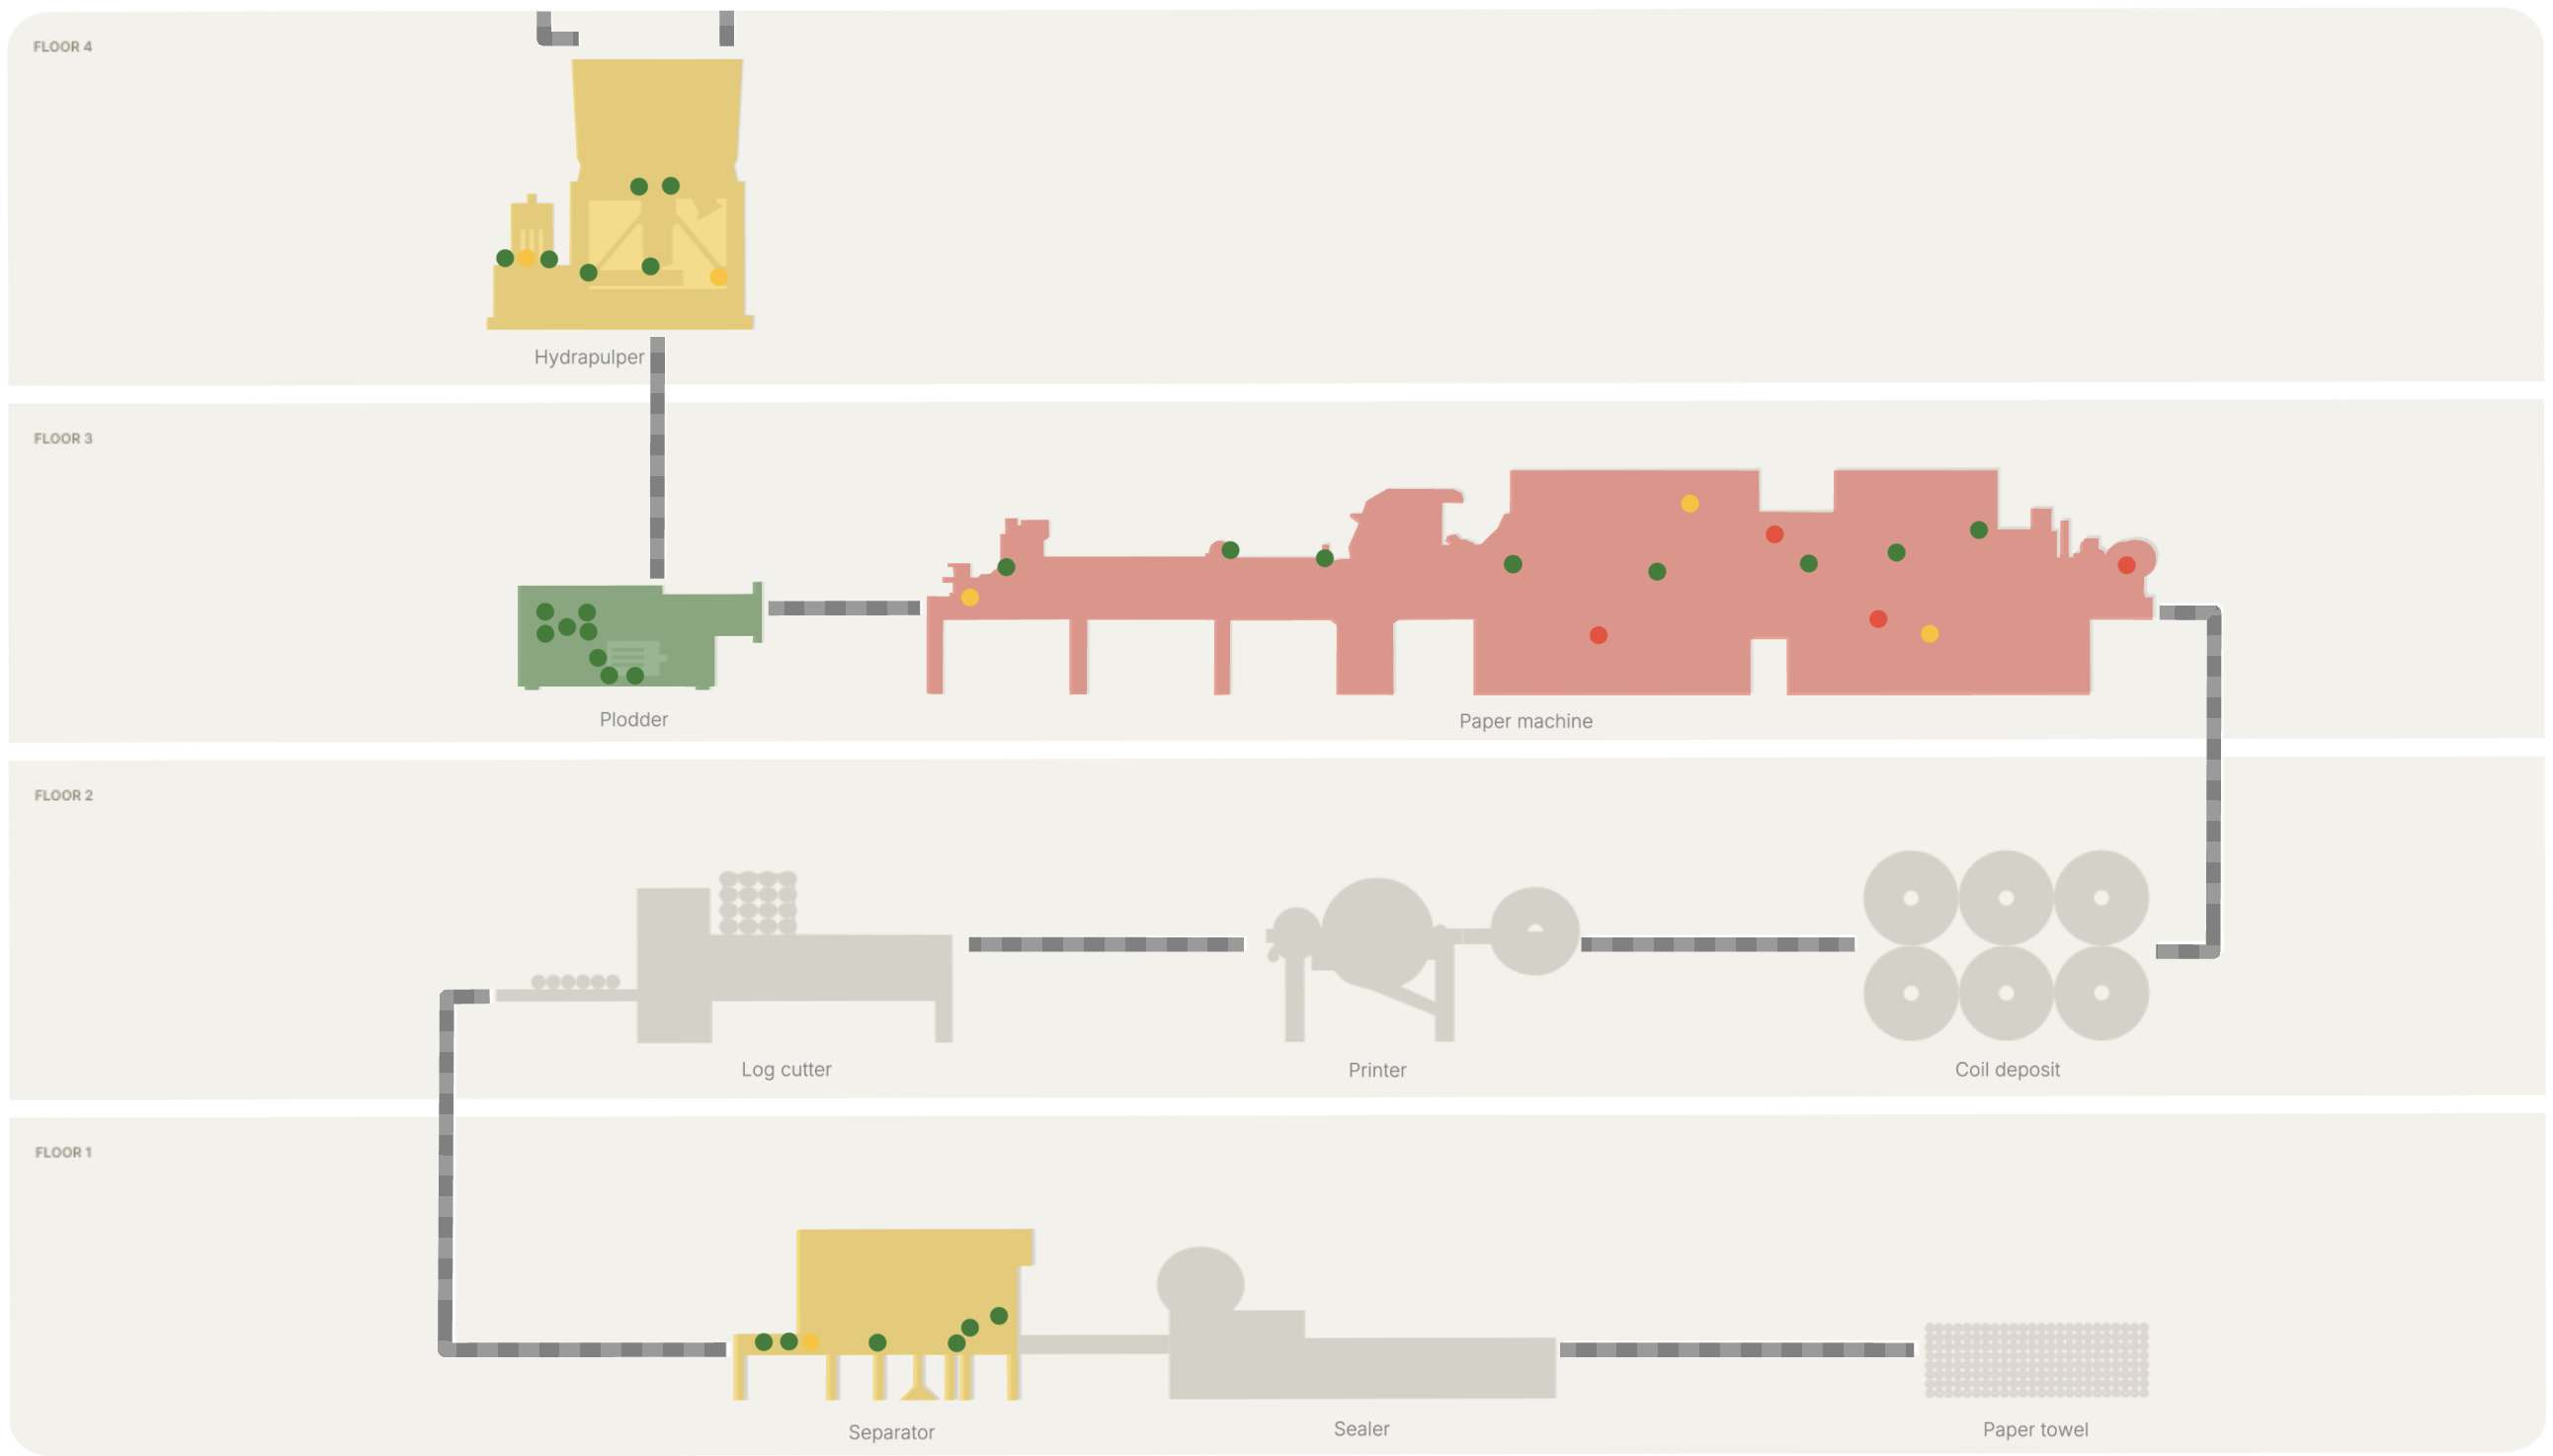

Hopara’s real time data visualization for digital twin technology is transforming how industries operate. Some examples:

Manufacturing Operations
Monitor machine status, detect process bottlenecks, and optimize production performance in real-time.

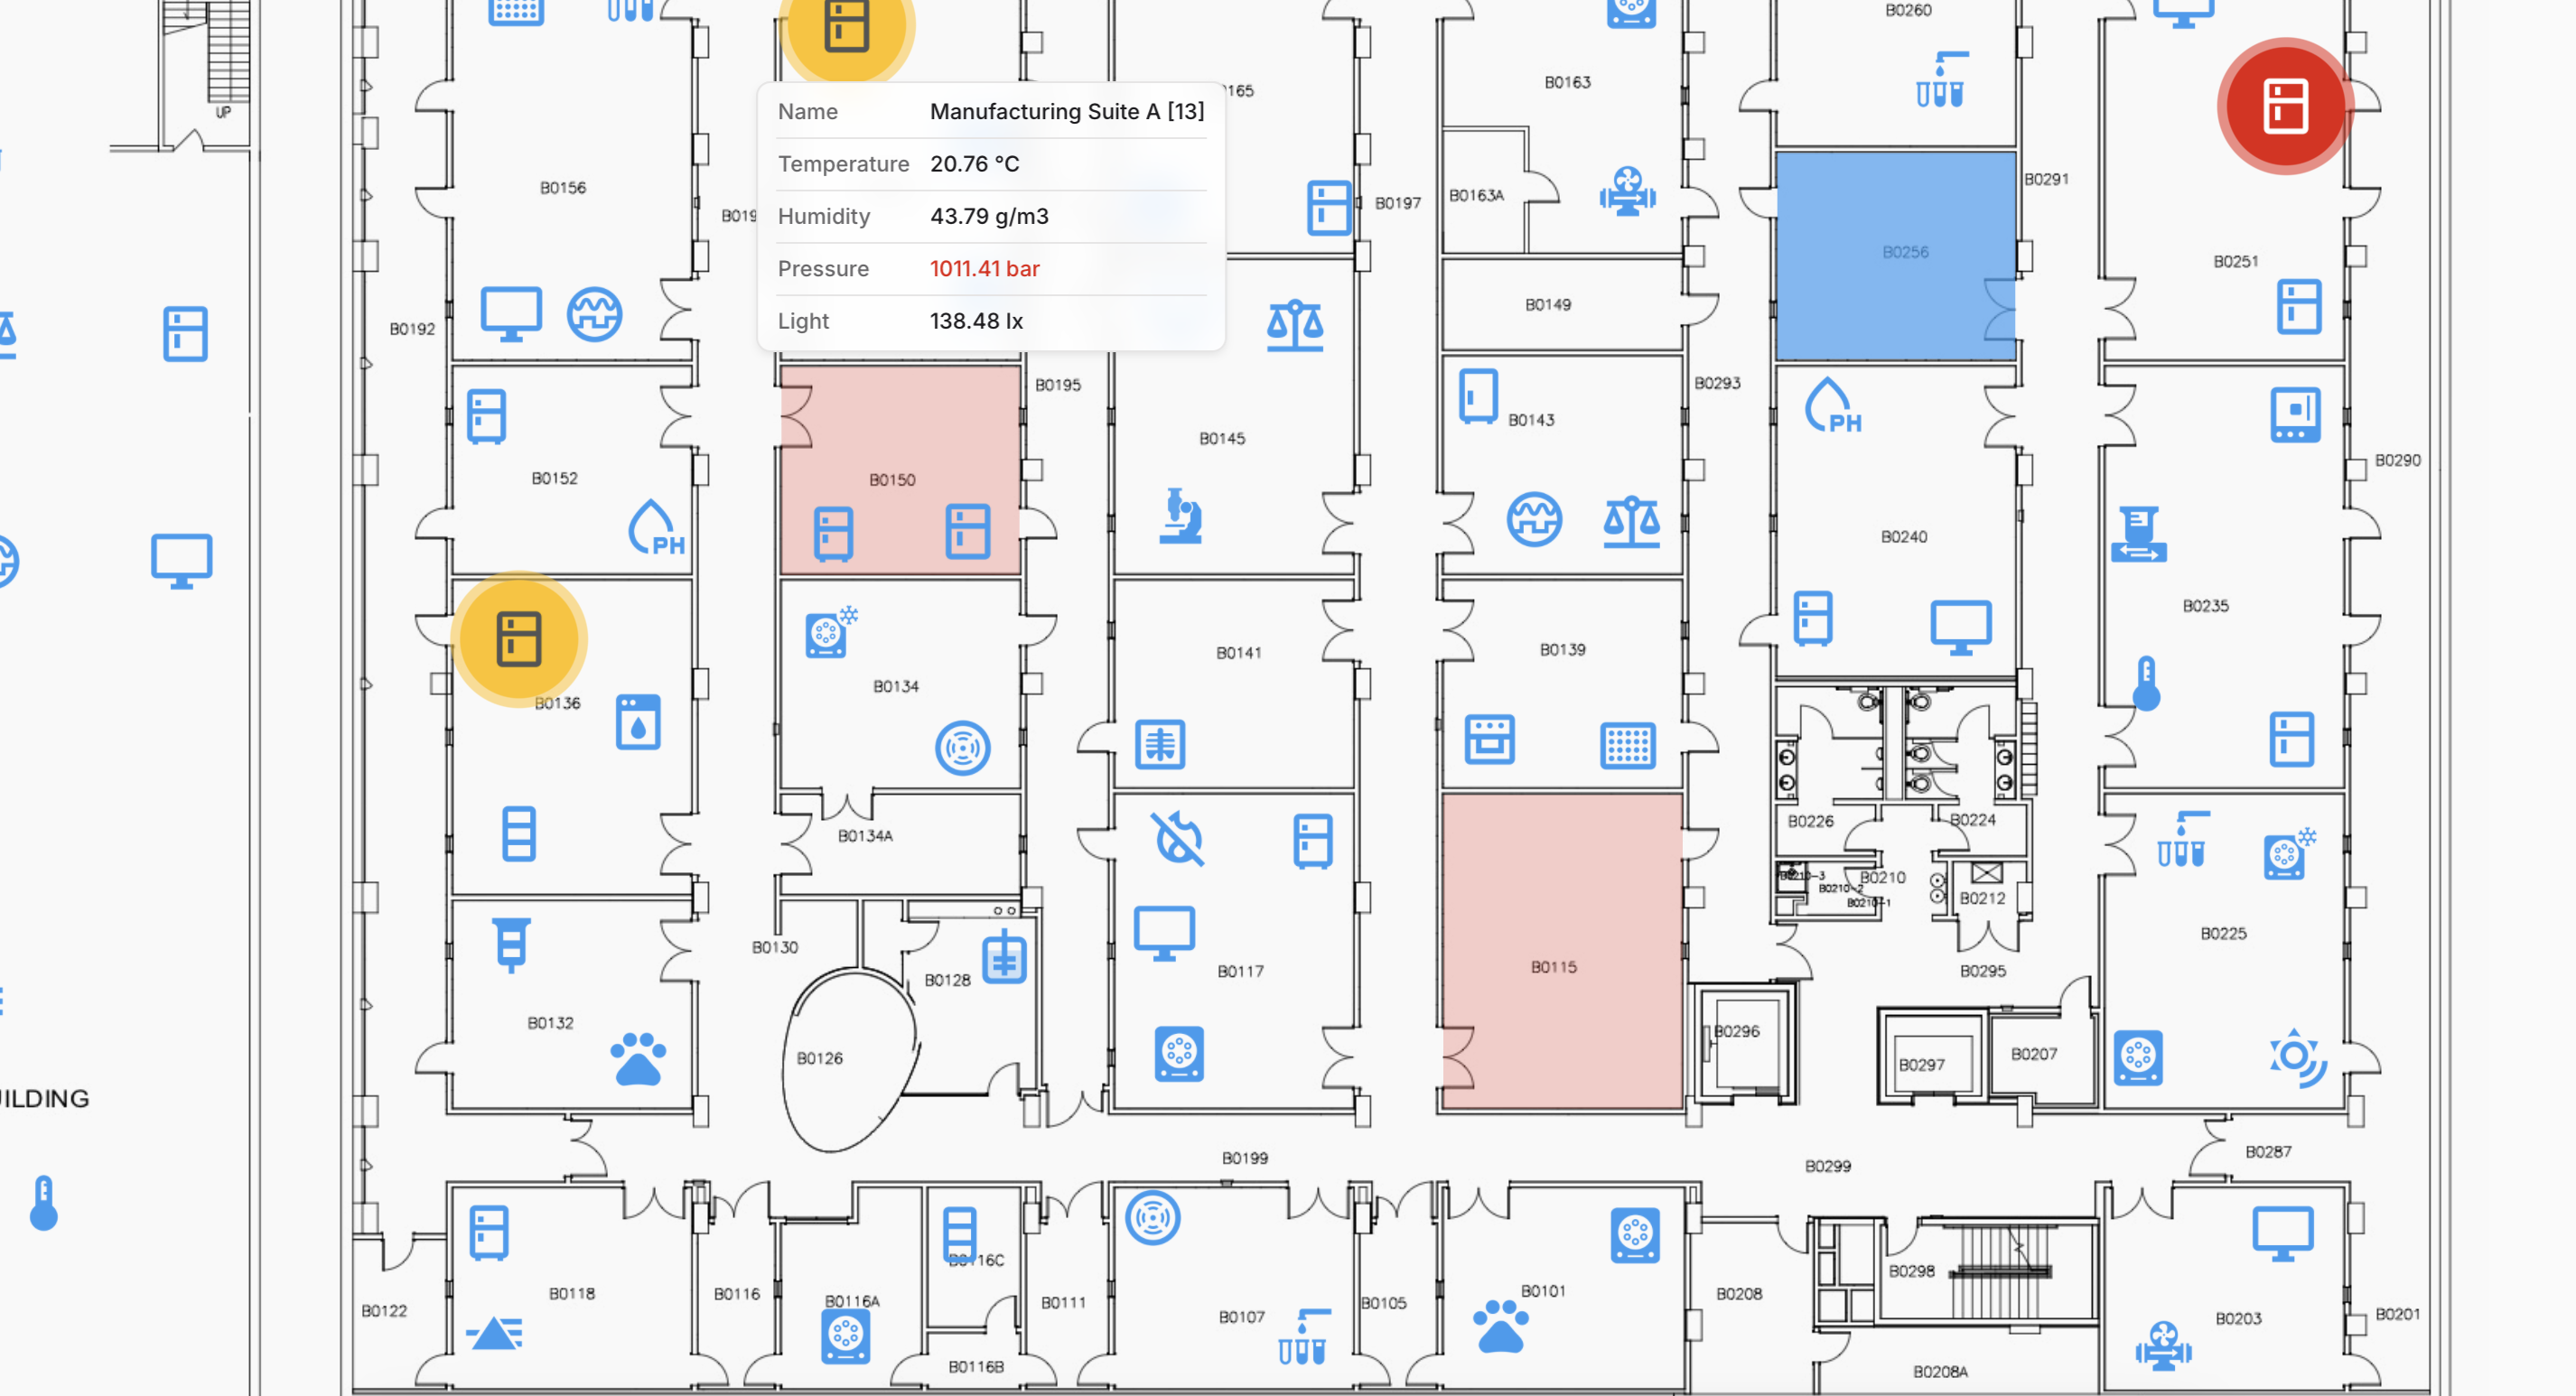
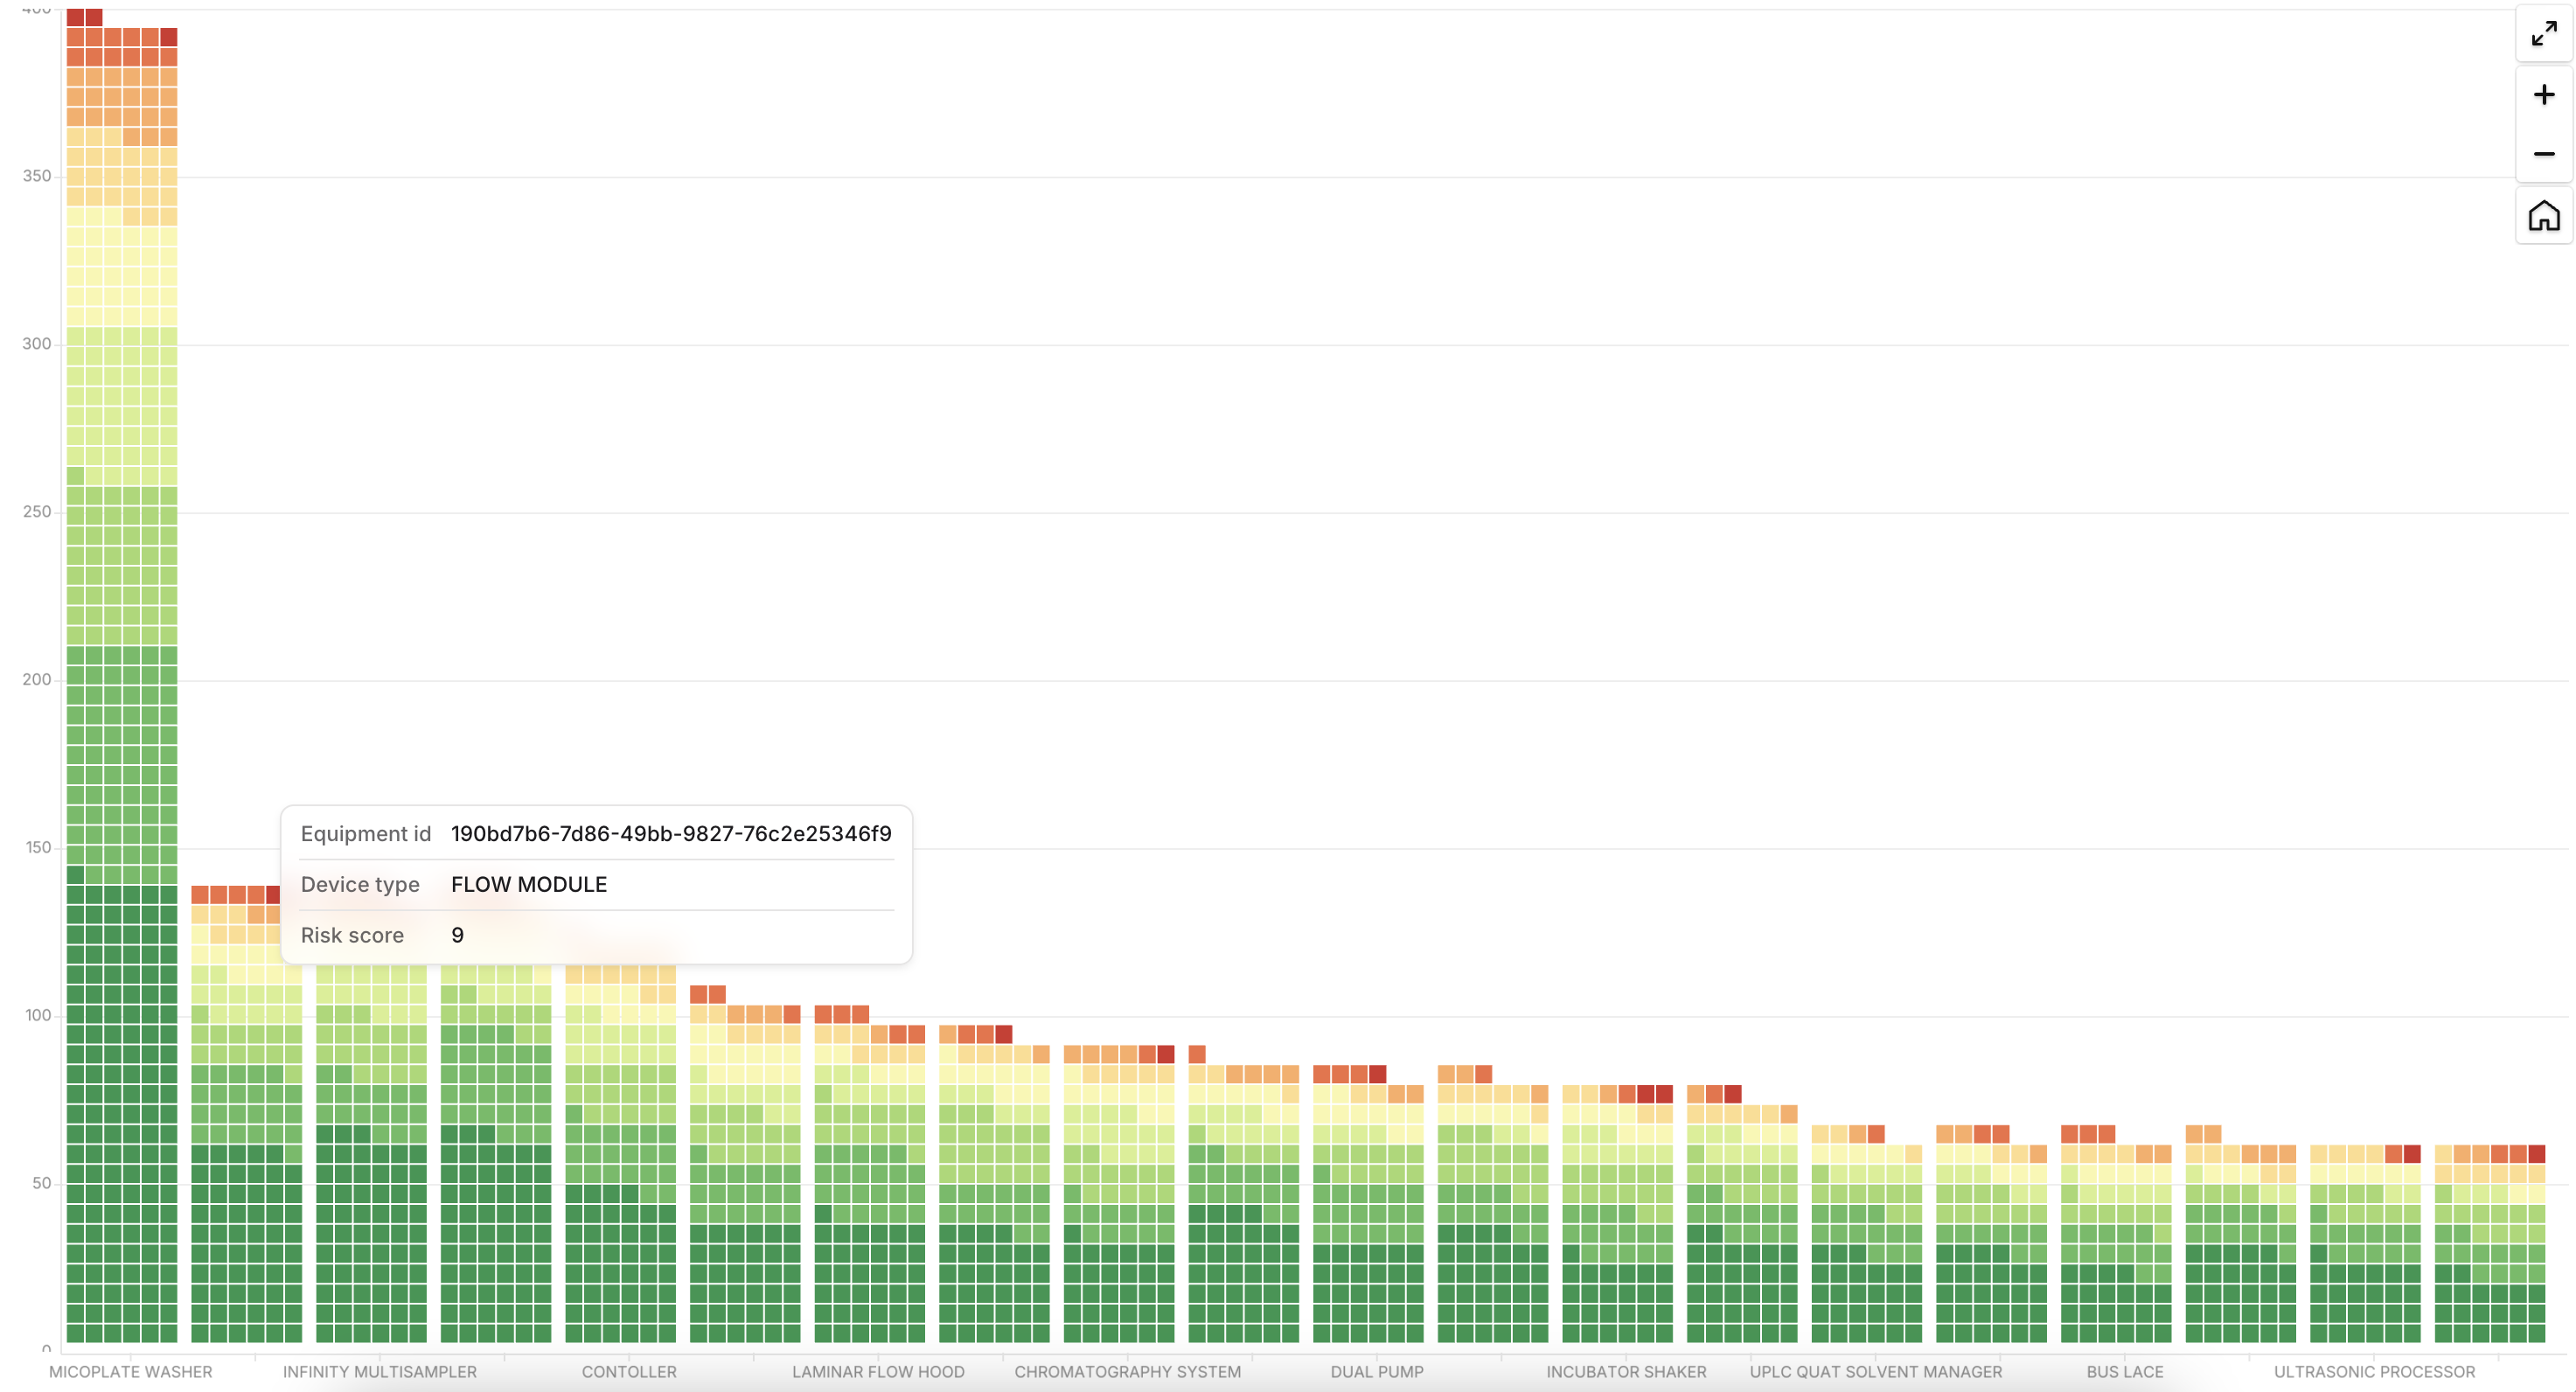
Pharmaceutical Labs
Visualize lab workflows, monitor equipment utilization, and ensure quality control across R&D and production.

Energy Infrastructure
Visualize equipment status, detect faults in real-time, and see power generation, distribution, and load balancing.

Warehouse Management
Track inventory levels in real-time, optimize space utilization, and improve order fulfillment with live operational visibility.