- Case Study
Global Consumer Goods Manufacturer – Multi-Level Factory Monitoring

About the Client
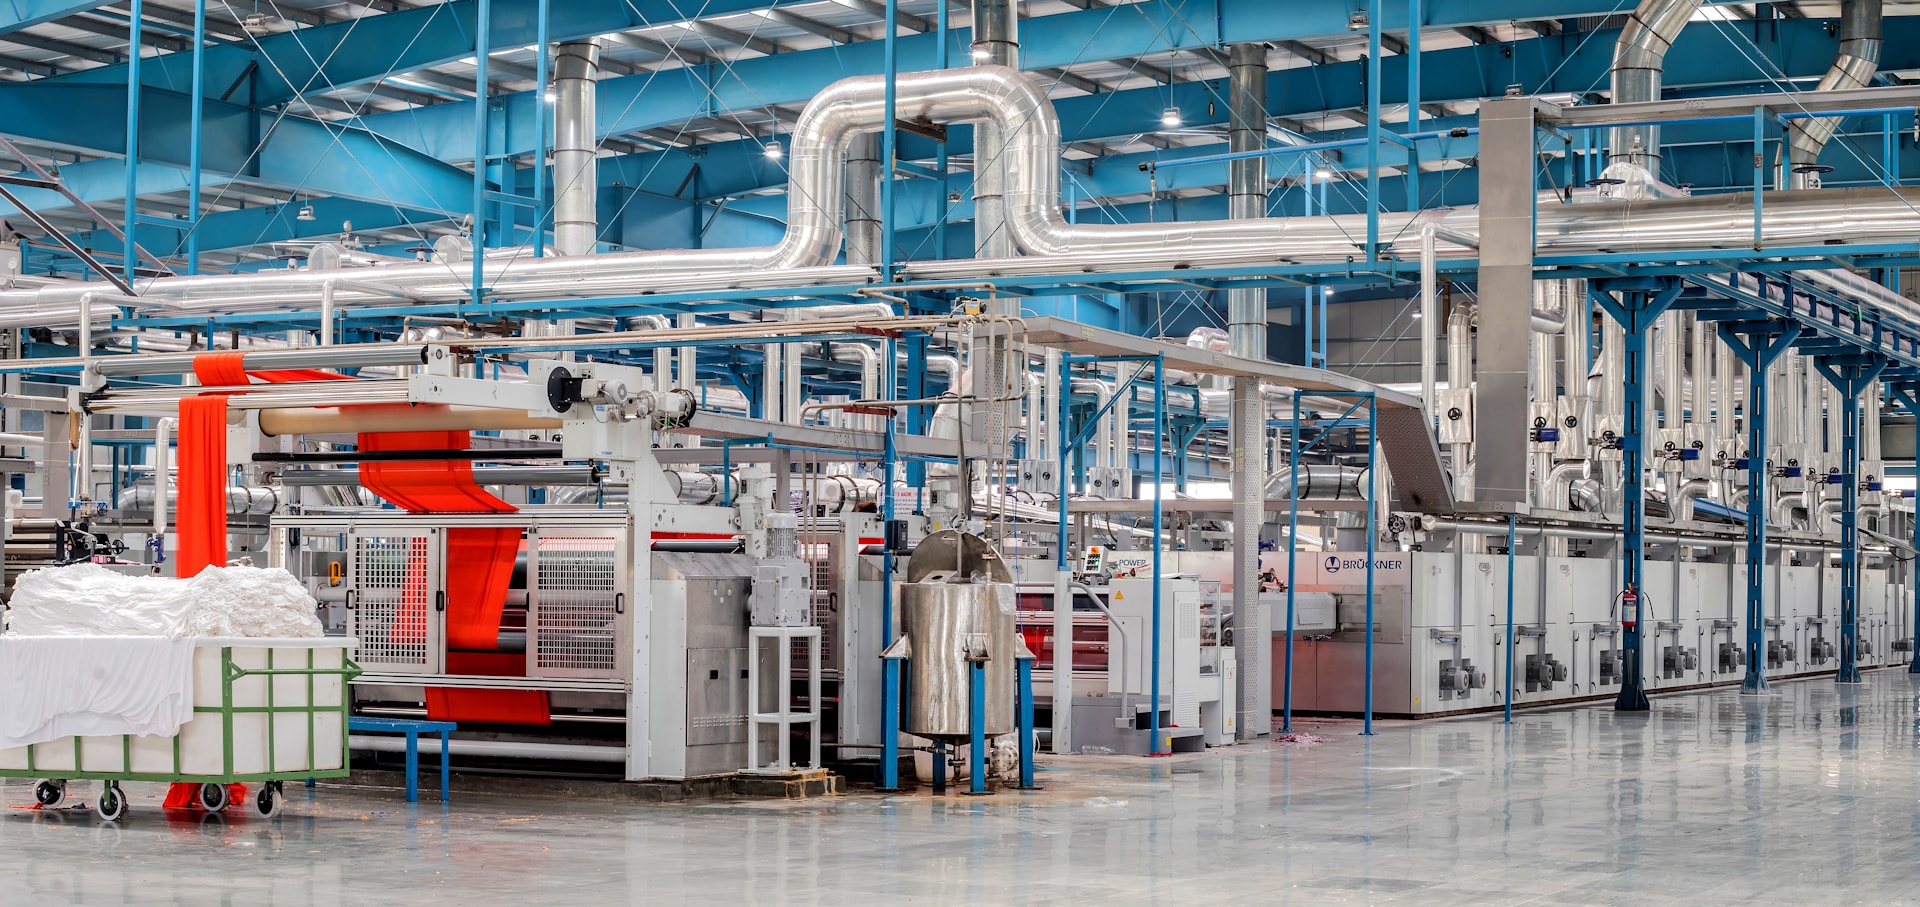
A leading global consumer goods company operates a large multi-story manufacturing facility that produces personal care products. The facility spans four floors and includes a wide range of interconnected equipment and technical systems. These systems are critical to ensuring high production throughput and maintaining stringent quality standards demanded by a highly competitive market.
Problem
The facility’s engineering and maintenance teams faced mounting challenges in monitoring and managing the production line across multiple levels. The complexity of the site’s infrastructure made it difficult to obtain a clear, real-time picture of operations. When faults or slowdowns occurred, isolating the root cause often involved manual investigation across different floors and systems, leading to delays in response.
Particularly in advanced machinery with layered internal systems, maintenance teams struggled to quickly pinpoint which subsystem or component was at fault. This resulted in extended Mean Time To Repair (MTTR), frequent production interruptions, and increased operational costs. The company needed a solution that could provide:
- Holistic visibility of the production process across floors.
- The ability to drill down to specific machines or components.
- Tools to support faster and more precise troubleshooting in complex equipment.
Solution
Hopara implemented an interactive, real-time flowchart visualization of the entire production line. This digital twin provided an at-a-glance overview of operational status across all four floors, using live data streams from the plant’s existing systems.
Key features included:
Floor-to-Machine Navigation: Engineers could start from a high-level floor view and zoom in seamlessly to inspect the performance of individual machines.
Interactive Technical Diagrams: For complex, multi-slice equipment (e.g., mixers, filling lines, packaging systems), Hopara embedded interactive schematics showing layered internal systems. This enabled teams to visualize subcomponents and identify problem areas instantly.
Real-Time Alerts and Contextual Data: Faults or anomalies were highlighted visually, with direct links to operational data and maintenance history for faster diagnosis.
Cross-Department Collaboration: The platform allowed engineering, production, and quality assurance teams to work off the same live system, reducing miscommunication and duplication of effort.
Result
Hopara’s solution transformed the way the engineering team monitored and responded to production issues.
- Reduced MTTR by 10%: Faster isolation and resolution of equipment faults led to significant reductions in downtime.
- Improved Production Continuity: With fewer and shorter interruptions, the plant maintained a smoother production flow, contributing to higher overall equipment effectiveness (OEE).
- Empowered Teams: Maintenance staff reported greater confidence in troubleshooting thanks to the detailed visualization of complex systems.
By providing a single source of truth for plant operations, Hopara enabled the client to meet its production targets more reliably while reducing stress on technical teams.
-
- Case Study
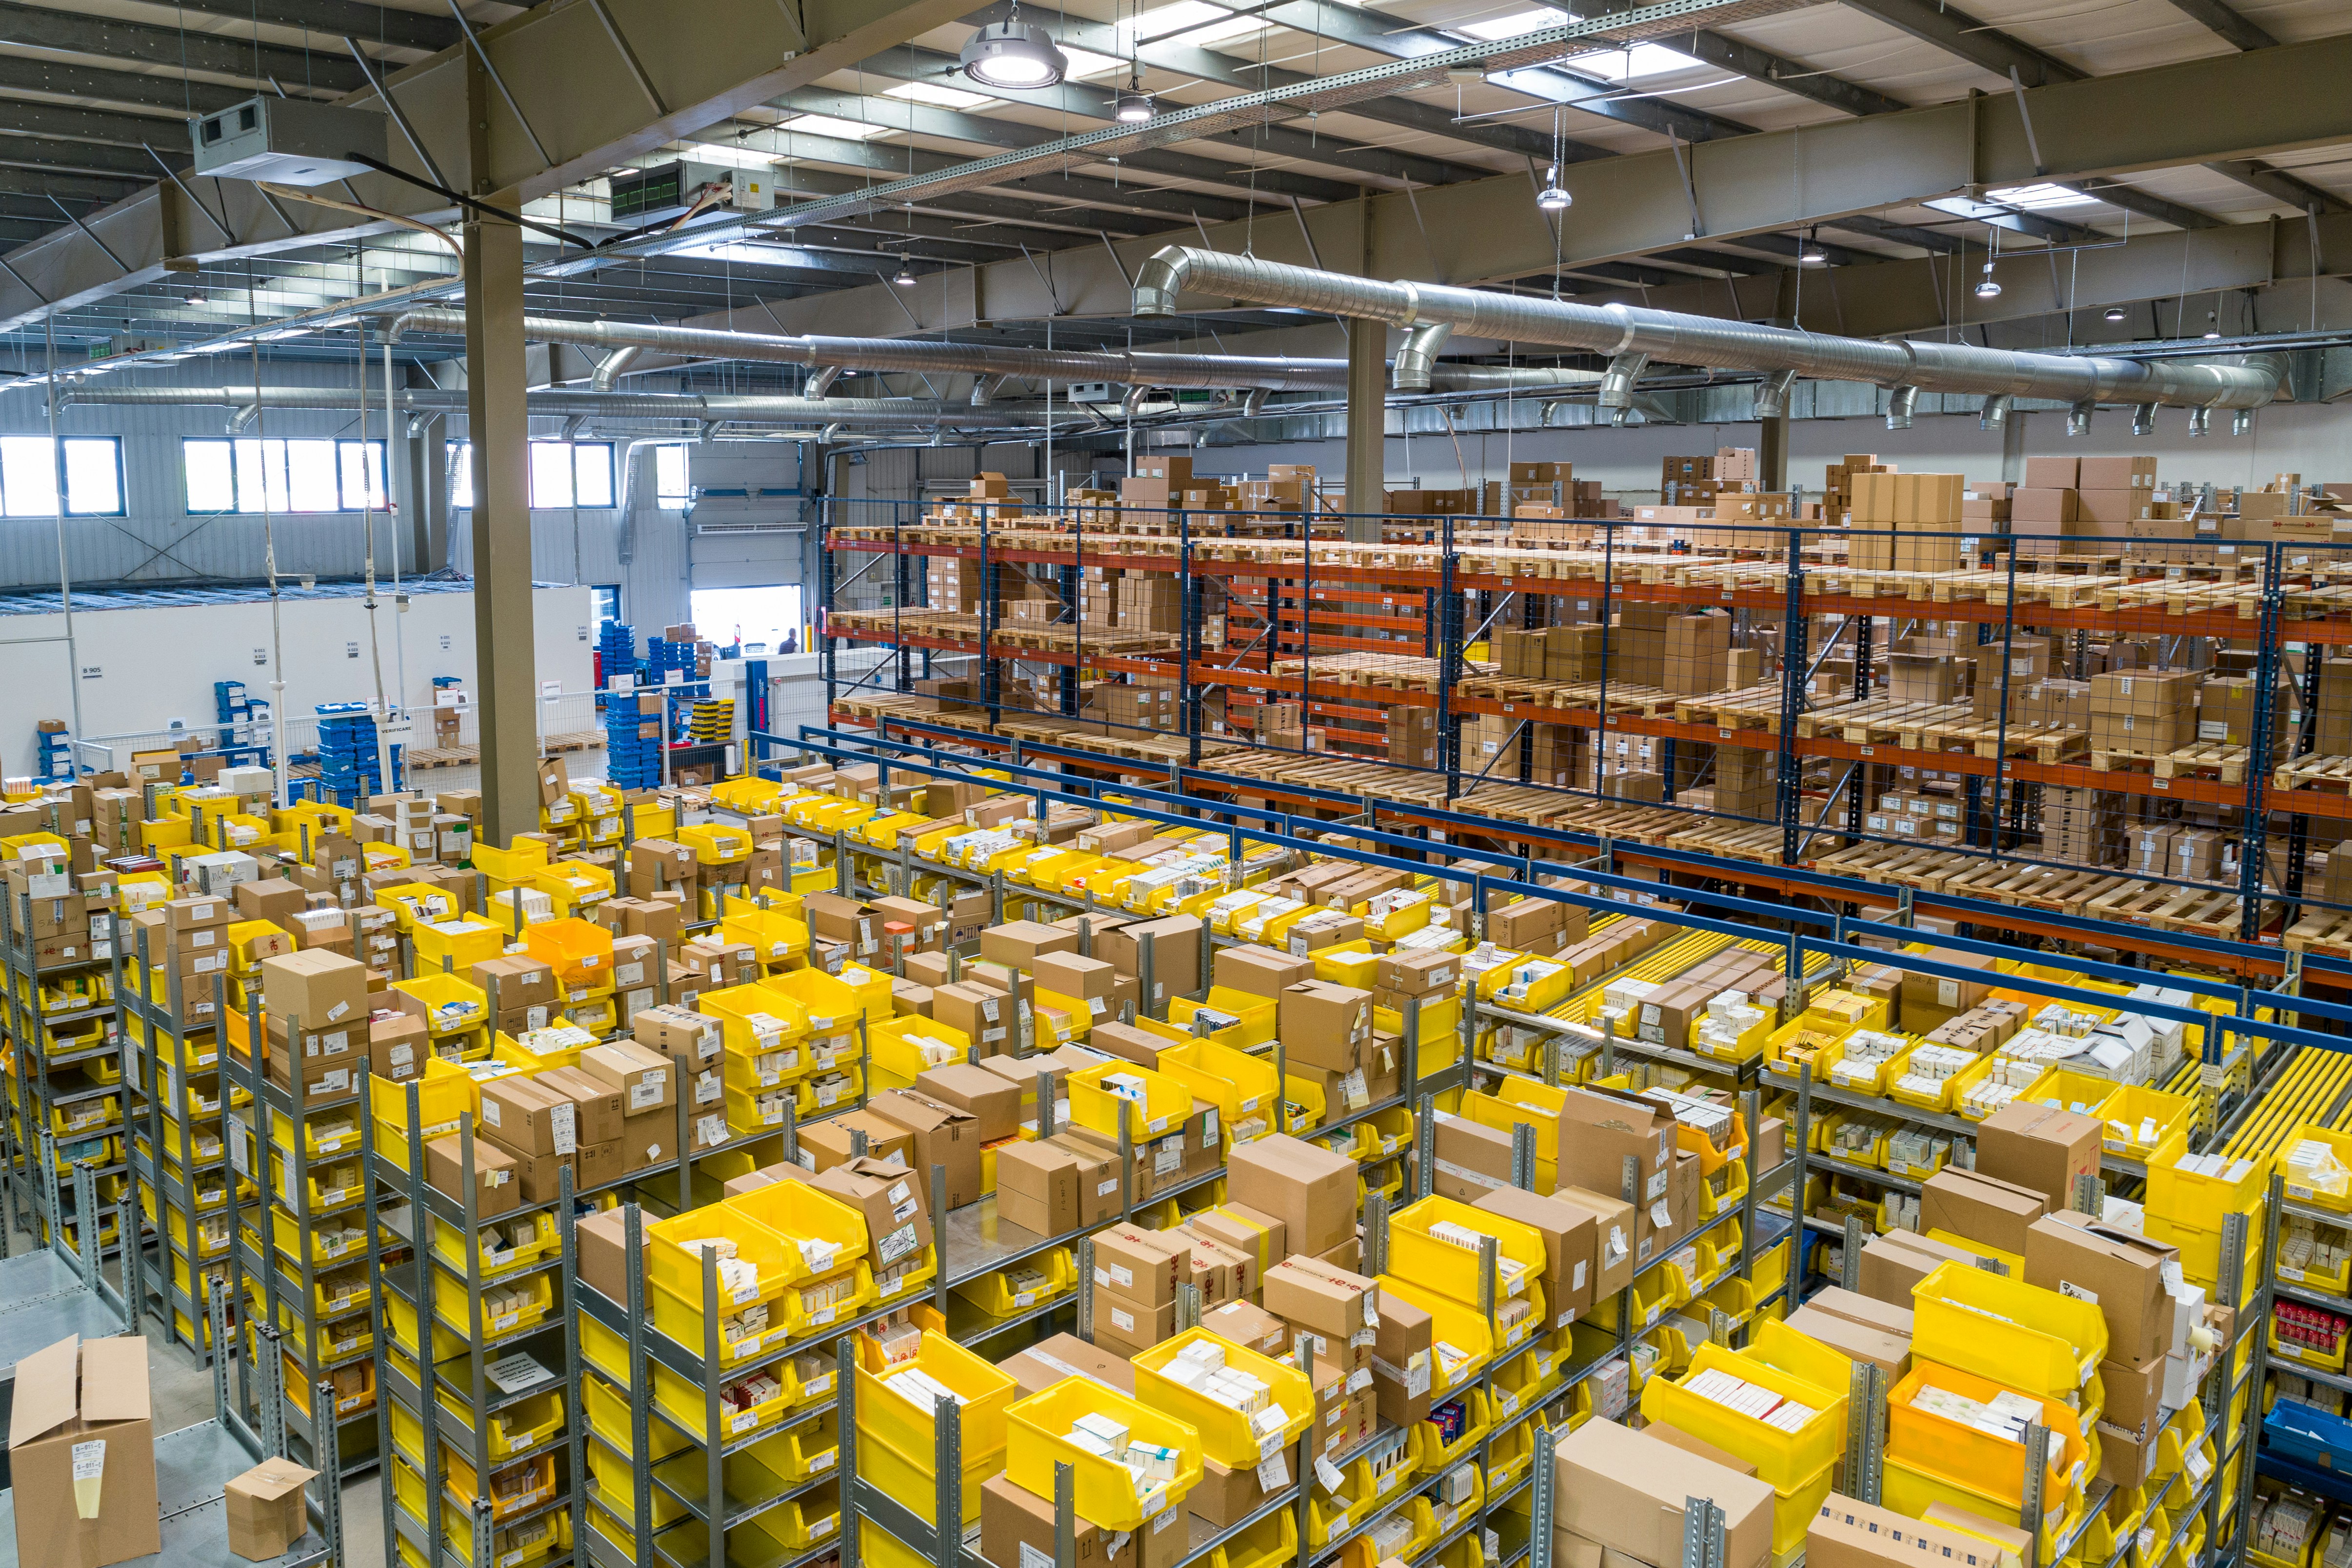
Latin American E-Commerce Leader – Warehouse Belt Monitoring
Discover how Hopara’s warehouse belt monitoring solution gave real-time visibility across 17 sites, reducing downtime and boosting...
-
- Case Study
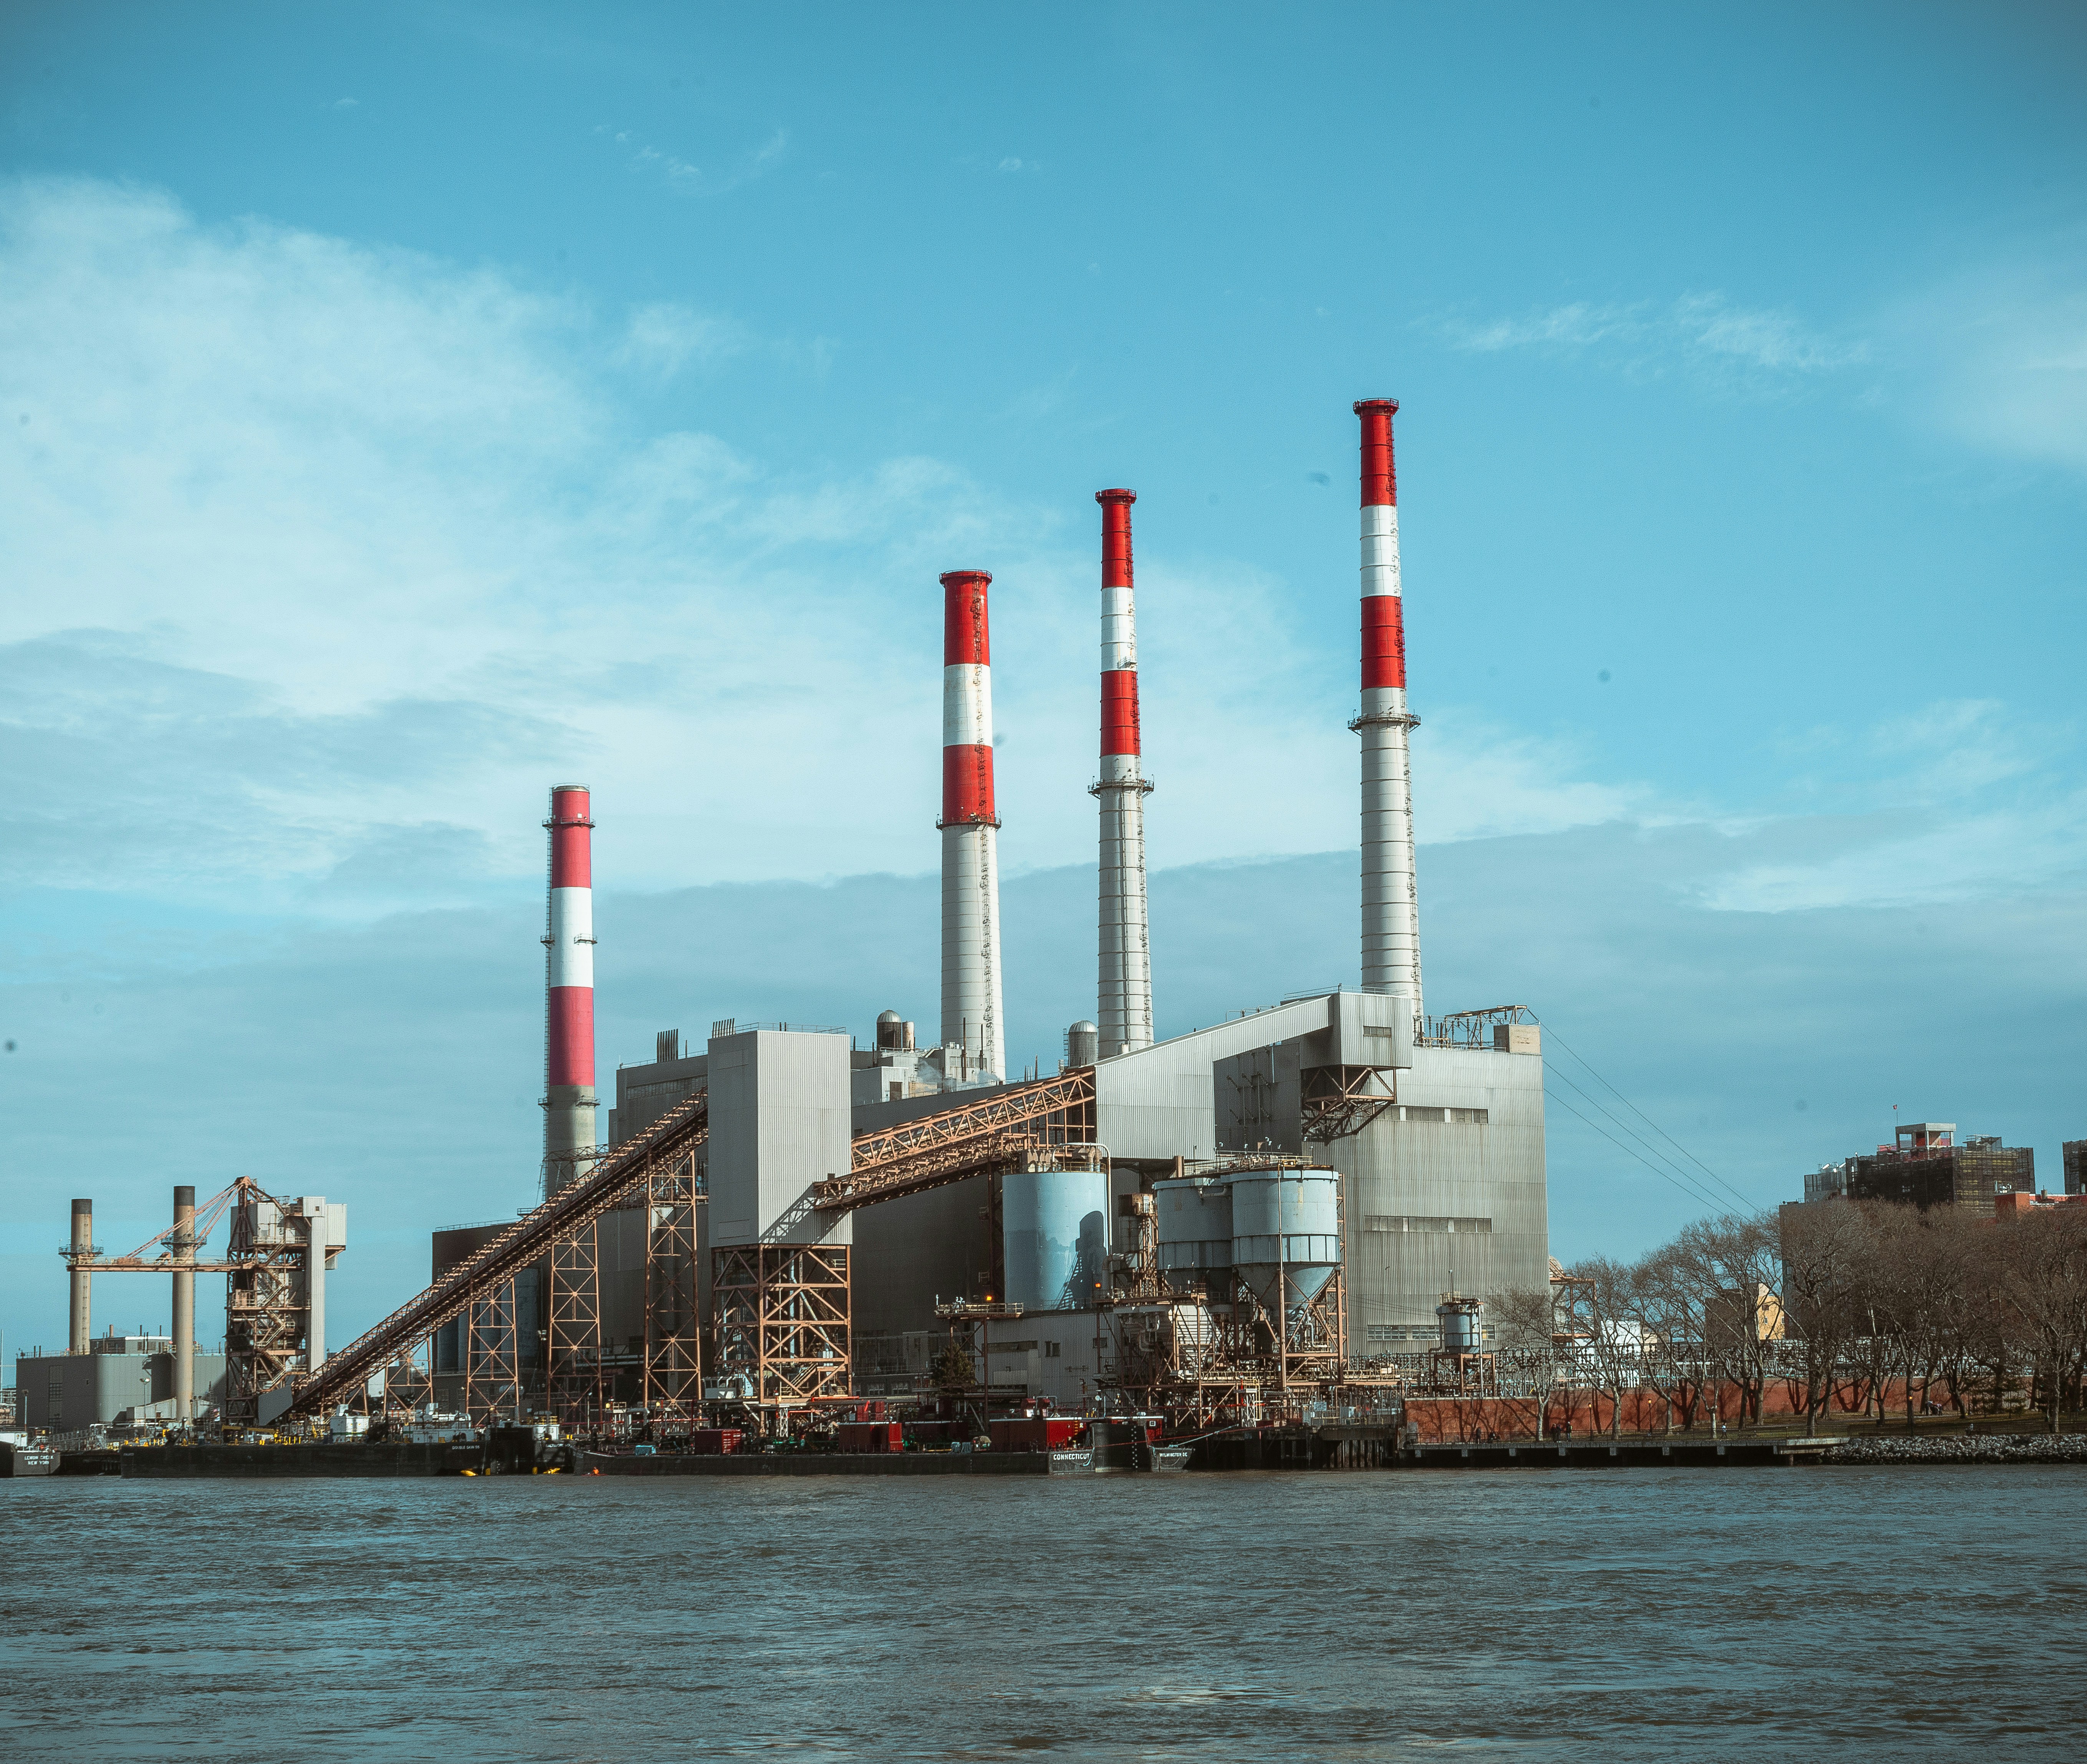
Global Industrial Manufacturer – Factory Oversight at Scale
Learn how Hopara streamlined factory oversight for a multinational firm, enabling real-time visibility across 58 sites and...
-
- Case Study
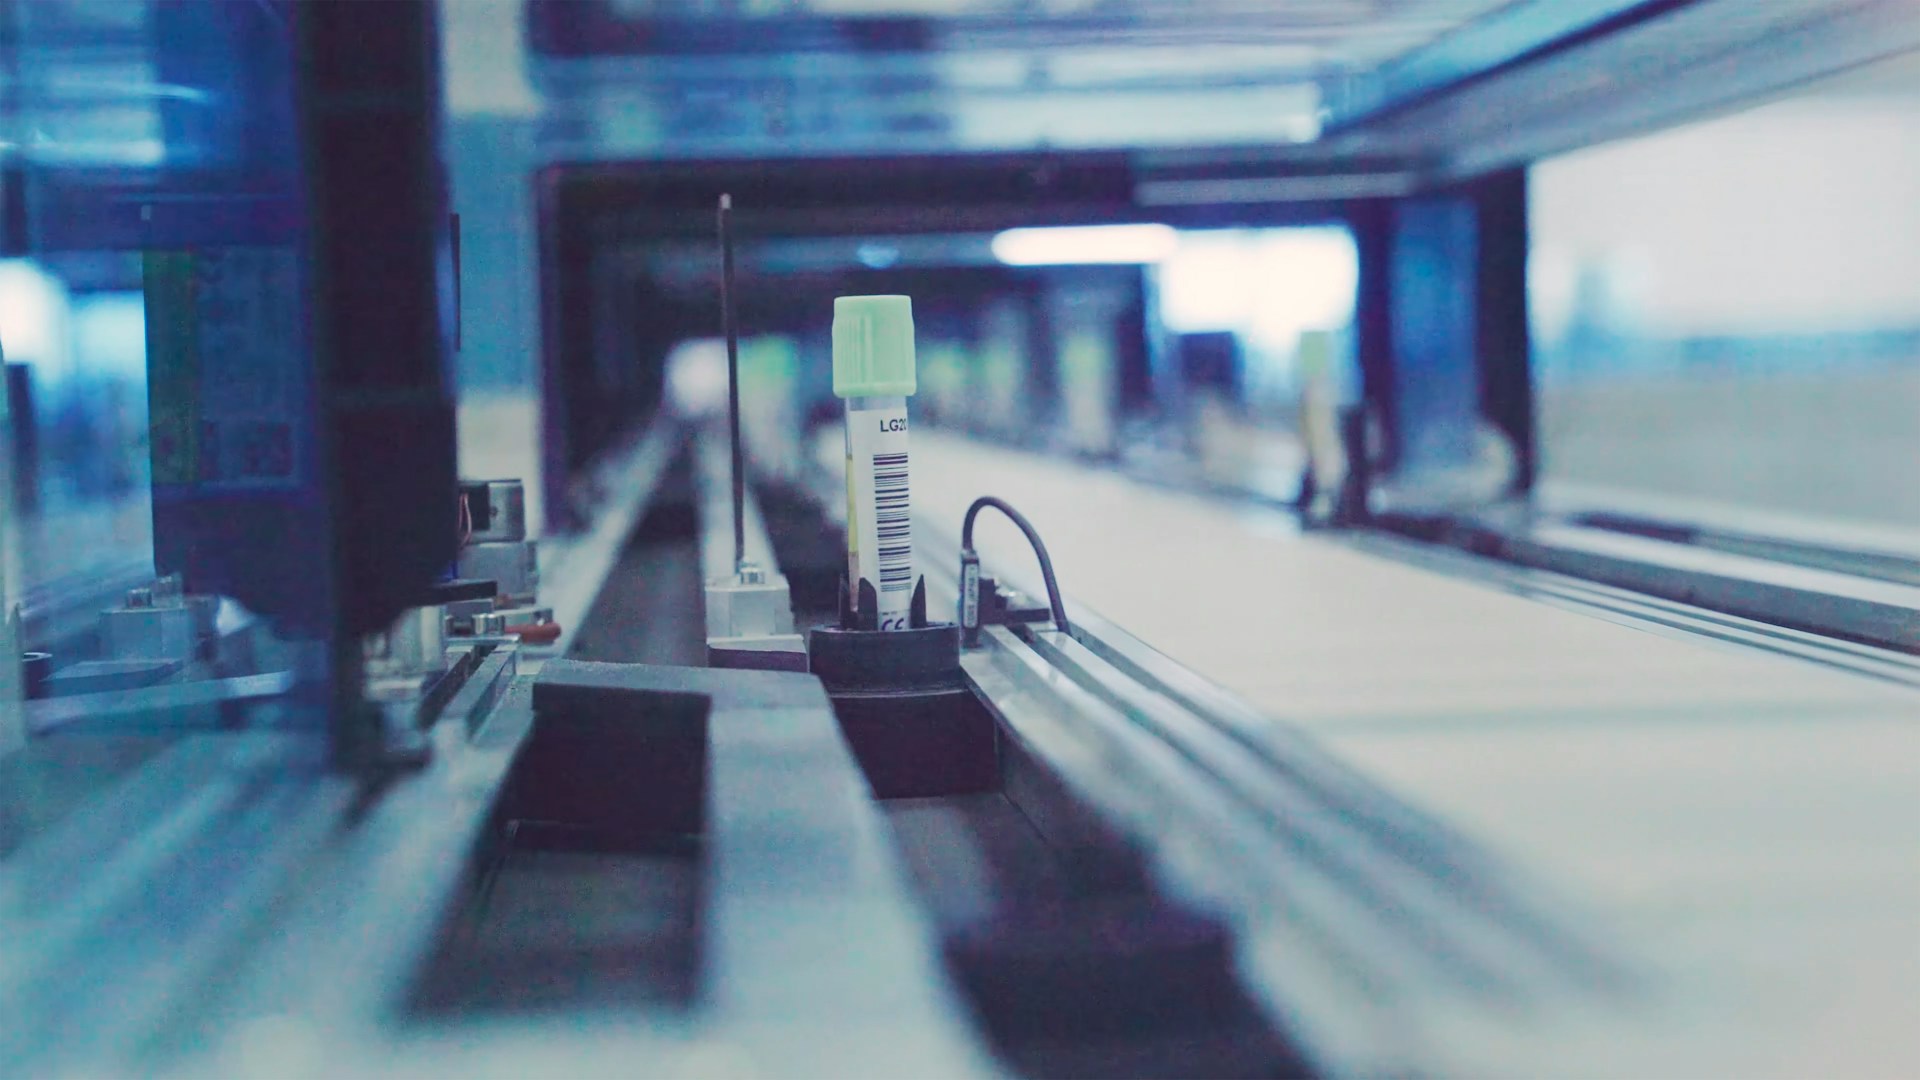
Environmental Monitoring for a Leading US Laboratory
Learn how Hopara transformed environmental monitoring for a CAP/CLIA lab, reducing losses and boosting compliance with real-time...