- Blog
Real-Time Data Visualization: Transforming Business Intelligence
Discover how real-time data visualization transforms business intelligence with powerful examples, a discussion of benefits, and implementation strategies for data-driven decisions.

Real-time data visualization has transformed how organizations interpret and use their data. While traditional methods analyze past information, real-time visualization displays data as it’s created, allowing immediate action on emerging trends. This capability is becoming essential for data analysts, BI professionals, and managers in the manufacturing, pharmaceuticals, and IoT sectors who need to maintain a competitive edge.
Organizations using intuitive visual dashboards can quickly spot operational inefficiencies, anticipate maintenance requirements, and adapt to market changes in minutes instead of days. Examples of real-time data visualization applications include production line monitoring dashboards, patient vital sign trackers, and fleet management systems that convert complex metrics into actionable insights.
Understanding Real-Time Data Visualization
Real-time data visualization shows information graphically as it’s generated or received. This approach eliminates delays between data creation and analysis, letting organizations respond to situations as they happen rather than after they’ve occurred.
Real-Time Visualization Defined
The process of translating continuously updating data streams into visual formats that can be interpreted immediately, enabling users to identify patterns, anomalies, and opportunities the moment they emerge in the data.
According to TechTarget, advanced visualization technologies are increasingly incorporating augmented reality elements, allowing users to interact with data in three-dimensional spaces for enhanced understanding and collaboration.
The Evolution from Static to Dynamic Visualizations
The shift from static reports to dynamic dashboards represents a fundamental change in data analysis capabilities. Static visualizations offer a fixed-in-time snapshot, which is useful for historical analysis but limited for current decision-making. Dynamic visualizations refresh automatically, providing continuously updated views of operational performance.
This evolution has led to improvements in data processing capabilities, with systems now able to handle millions of data points per second. Manufacturing facilities leverage this capability to track production metrics across multiple lines simultaneously, with Tulip reporting that real-time monitoring dashboards have reduced response times to quality issues.
Key Components of Effective Real-Time Dashboards
Effective real-time dashboards balance technical capability with usability. The most successful implementations share several critical characteristics:
- Relevance and context: Displaying only the metrics that matter for specific user roles, avoiding information overload while providing sufficient context for interpretation
- Visual hierarchy: Using size, color, and positioning to direct attention to the most critical information first
- Intuitive interactivity: Allowing users to drill down into data points without requiring technical expertise
- Responsive design: Adapting to different screen sizes and devices to enable monitoring from anywhere
Data integration capabilities are equally important, with modern platforms connecting to a variety of systems to create comprehensive views across organizational silos. This connectivity ensures that dashboards reflect the complete operational picture rather than isolated data fragments.
Benefits of Implementing Real-Time Data Visualization
Organizations that embrace this technology gain a competitive edge through enhanced operational awareness and responsiveness. Let’s explore the specific benefits that make real-time visualization a must-have for forward-thinking companies.
Accelerating Decision-Making Processes
Real-time data visualization dramatically reduces the time between insight and action. Traditional reporting processes often introduce delays of hours or even days between when data is generated and when decision-makers can access it. This lag creates missed opportunities and delayed responses to critical situations.
The speed at which an organization can move from data acquisition to informed action. Real-time visualization increases decision velocity by providing instant access to current performance metrics, allowing teams to respond to changing conditions without waiting for scheduled reports.
Companies that implement real-time analytics solutions typically reduce decision-making timeframes compared to those relying on traditional reporting methods. The acceleration becomes particularly valuable in fast-moving environments like manufacturing floors, where production issues can quickly cascade into major disruptions if not addressed promptly. With real-time visualizations, floor managers can spot potential bottlenecks as they form and reallocate resources before productivity suffers.
Enhancing Operational Efficiency
Real-time visibility into operations allows organizations to optimize resource allocation continuously. Rather than discovering inefficiencies after the fact, managers can identify and correct them as they emerge.
For example, pharmaceutical manufacturing facilities using real-time equipment monitoring can detect minute variations in performance that might indicate a need for maintenance before potential repairs can cause production delays. This predictive capability transforms maintenance from reactive to preventive, significantly reducing downtime.
Improving Risk Management and Anomaly Detection
One of the most powerful applications of real-time data visualization is identifying outliers and anomalies that might indicate emerging problems. Unusual patterns that would be difficult to spot in tables of numbers become immediately apparent when presented visually. The table below summarizes some relevant approaches.
| Anomaly Detection Approach | Response Time | Detection Accuracy | Resource Requirements |
|---|---|---|---|
| Manual Report Analysis | Hours to Days | Medium (dependent on analyst) | High (analyst time) |
| Periodic Automated Alerts | Hours | Medium-High | Medium |
| Real-Time Visual Monitoring | Seconds to Minutes | Very High | Low (after setup) |
Banking and financial institutions have been early adopters of this capability, using real-time visualization to detect fraudulent transactions.
Boosting Customer Experience
Real-time visualization also transforms customer interactions by enabling personalized responses based on immediate behavior and needs. Retail and e-commerce companies leverage this capability to adjust offerings based on browsing patterns, cart contents, and previous purchases.
For IoT applications, real-time visualization allows service providers to monitor device performance and preemptively address issues before customers even notice them. This approach significantly improves satisfaction scores and reduces support calls.
The impact extends to internal customers as well. IT departments using real-time dashboards to monitor system performance can spot and address potential issues before they affect users, maintaining higher availability and satisfaction levels throughout the organization.
Real-Time Data Visualization Platform for
IoTLife SciencesData LakesManufacturing
-

Interactive 3D Models
Add relevant context such as floor plans, technical drawings, and maps
-

Semantic Zoom Capability
Effortlessly navigate and drill-down between different levels of detail
-

Configurable Dashboards
Design visualizations exactly how you’d like to see them
Powerful Real-Time Data Visualization Examples
Real-time data visualization transforms abstract numbers into actionable insights across diverse industries. The following practical applications demonstrate how organizations leverage dynamic visualizations to monitor critical operations, respond to changing conditions, and drive improvements through immediate data access.
Manufacturing Production Monitoring
Manufacturing facilities rely on real-time data visualization to maintain optimal production efficiency. Modern factories connect equipment sensors directly to visualization dashboards that display metrics such as throughput, quality control measurements, and machine performance in real time.
Digital Production Twins
Advanced manufacturing dashboards create virtual representations of physical production lines, displaying real-time status, performance metrics, and predictive maintenance alerts that enable operators to spot issues before they cause shutdowns.
Financial Market Analytics
Financial institutions use real-time visualization to track market movements, trading activity, and risk exposure. These systems process millions of data points per second to deliver immediate insights on market conditions.
Trading platforms display multiple data streams simultaneously, including price movements, volume analysis, and algorithmic signals. Financial services companies using real-time analytics identify profitable trading opportunities faster than competitors using traditional methods—a critical advantage in high-frequency trading environments.
Healthcare Patient Monitoring Systems
Healthcare providers implement real-time visualization to track patient vital signs and treatment outcomes. Critical care units display continuous monitoring of heart rate, blood pressure, oxygen levels, and medication delivery through intuitive dashboards. These dashboards rely on a multi-step process that ensures accurate, timely, and actionable information is delivered to clinical staff. The process typically includes the following components:
- Data collection: Patient monitors capture vital signs and send readings to central systems continuously.
- Signal processing: Software filters signal noise and validates readings against expected ranges.
- Visualization rendering: Dashboards display current values with clear color-coding for normal/abnormal ranges.
- Trend analysis: Systems plot recent history to highlight directional changes requiring attention.
- Alert generation: Visual and auditory alerts trigger when parameters exceed safety thresholds.
Following this monitoring approach enables healthcare teams to respond to patient deterioration faster than with periodic manual checks, according to research from medical technology providers.
IoT Device Performance Tracking
IoT applications generate massive data volumes that become actionable through real-time visualization. Smart city implementations track traffic flow, energy usage, and environmental conditions through integrated dashboards that help managers respond to changing conditions.
One notable example comes from utility companies using smart grid monitoring. These systems visualize electricity distribution networks, highlighting consumption patterns, detecting outages, and identifying potential transformer failures before they occur. The Microsoft Power BI real-time streaming documentation provides implementation guidance for similar systems.
Supply Chain Visibility
Modern supply chain operations depend on real-time visualization to track inventory, shipments, and logistics performance. These dashboards connect data from warehouses, transportation systems, and retail locations to provide comprehensive visibility.
Retailers use these systems to track stock levels across stores, monitor delivery status, and adjust ordering based on real-time sales data. This capability becomes especially valuable during peak shopping periods when demand patterns can change rapidly.
Implementing Effective Real-Time Data Visualization
Turning raw data streams into meaningful visualizations requires careful planning and thoughtful implementation. Organizations need to consider both technical requirements and user needs to create dashboards that deliver genuine business value.
Best Practices for Dashboard Design
The visual design of real-time dashboards significantly impacts their effectiveness. Thoughtful layouts and visual choices help users quickly extract meaning from complex data streams.
The “five-second rule” says that an effective real-time dashboard should communicate its most critical insights within five seconds of viewing. This principle guides designers to prioritize the most important metrics and make them immediately recognizable through size, position, and color.
Create intuitive layouts by organizing related metrics together and establishing a clear visual hierarchy. Use consistent color coding (e.g., red for alerts, green for positive status, and amber for caution) to help users interpret information at a glance.
How Hopara Transforms Data into Actionable Insights
Hopara’s platform simplifies real-time data visualization through its intuitive interface and powerful connectivity options. The platform processes streaming data from diverse sources—such as manufacturing equipment sensors, data lakes, data warehouses, data tools, and IoT devices—and transforms it into meaningful visualizations.
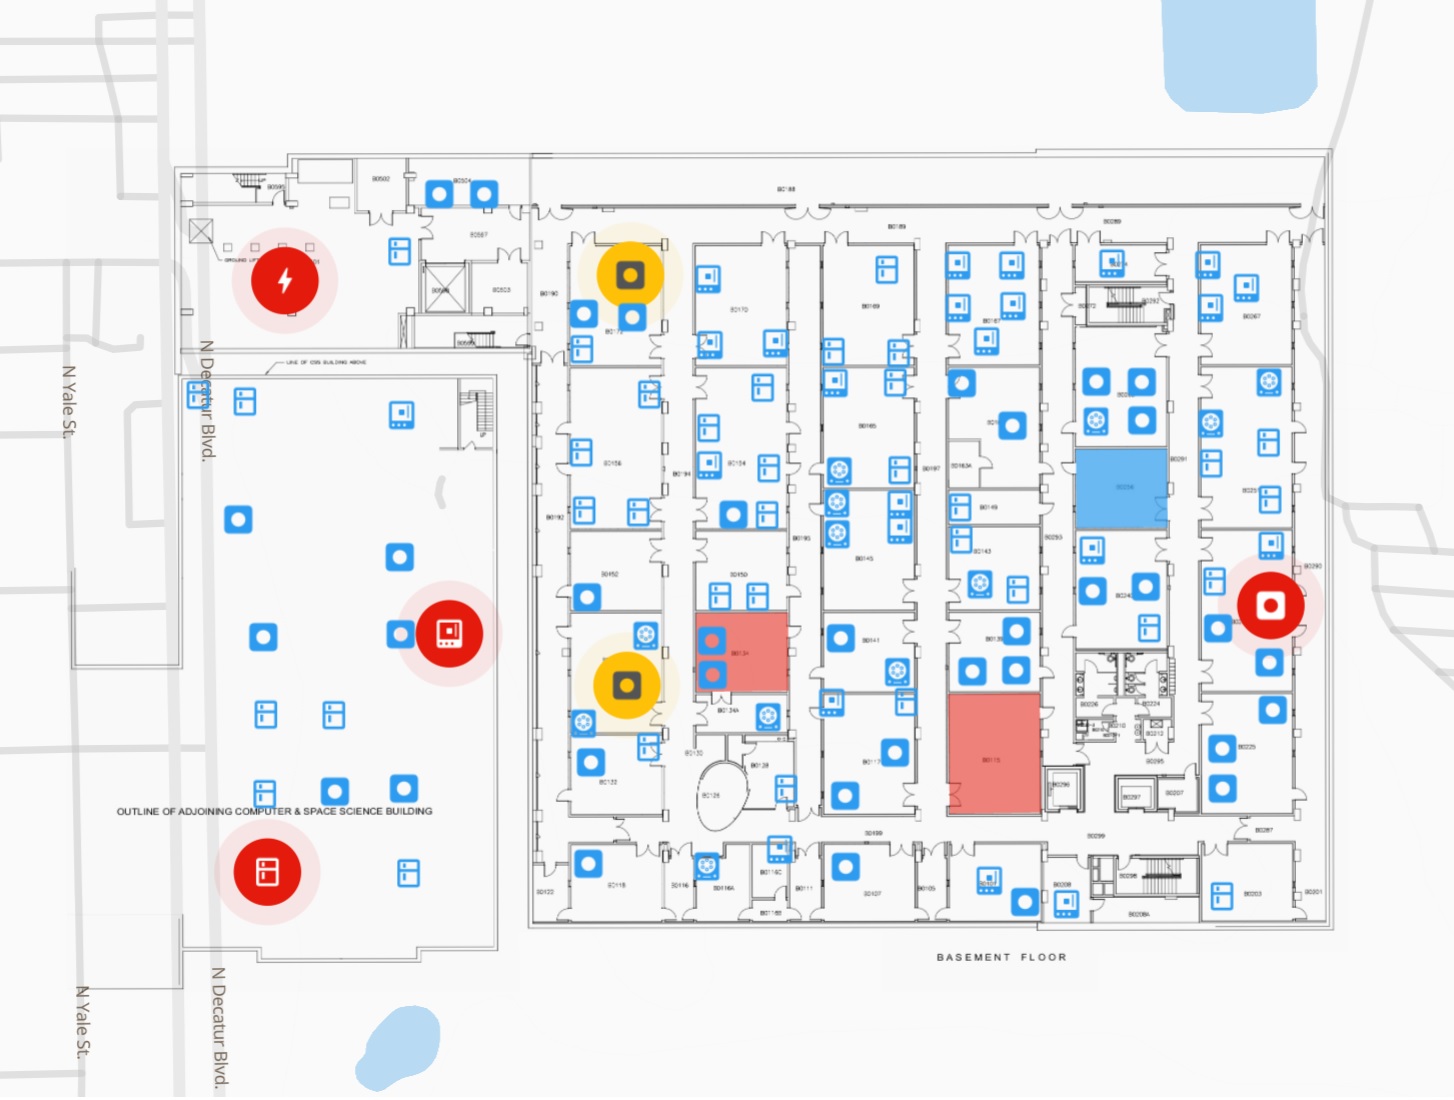
An example of real-time visualization using Hopara
With Hopara, both technical and non-technical users can create real-time dashboards without extensive training. The platform’s drag-and-drop interface allows users to design custom visualizations, while its advanced analytics capabilities automatically highlight anomalies and trends that might otherwise go unnoticed.
Overcoming Common Implementation Challenges
Implementing real-time data visualization systems comes with technical and organizational hurdles. Data quality issues, integration complexities, and user adoption frequently challenge successful deployments.
Start with a pilot project focused on high-value use cases to demonstrate benefits quickly. According to First Site Guide, there are 5.47 billion internet users globally. Organizations must ensure that their visualization systems perform reliably across various devices and connection speeds.
For optimal results, combine technical implementation with user training that helps teams understand how to interpret and act on the visualizations. This integrated approach turns real-time data from a technical capability into a genuine business advantage. Schedule a demo to see how Hopara can help your organization implement effective real-time visualizations.
Conclusion: The Future of Real-Time Data Visualization
Real-time data visualization is drastically changing how companies extract value from their information resources. Coming advances in technology promise even more refined capabilities that combine predictive analytics with instant visual feedback, allowing businesses to respond to current situations and forecast upcoming scenarios. The combination of AI-enhanced analytics with user-friendly visual interfaces will help these tools reach wider audiences throughout organizations.
Schedule a demo today to discover how Hopara’s real-time visualization platform can transform your raw data streams into clear, actionable insights that drive better decisions throughout your organization.
Real-Time Data Visualization Platform for
IoTLife SciencesData LakesManufacturing
-
Interactive 3D Models
Add relevant context such as floor plans, technical drawings, and maps
-
Semantic Zoom Capability
Effortlessly navigate and drill-down between different levels of detail
-
Configurable Dashboards
Design visualizations exactly how you’d like to see them
FAQs
How does real-time data visualization differ from traditional business intelligence reporting?
Real-time data visualization displays information the moment it’s created, allowing immediate responses to emerging patterns, while traditional BI reporting examines historical data in scheduled batches. This key distinction enables companies to shift from responding after issues occur to addressing them as they develop, fundamentally changing how decisions get made.
What industries benefit most from implementing real-time data visualization solutions?
Manufacturing, healthcare, financial services, and industries with heavy IoT usage receive the greatest benefits from real-time data visualization. These fields operate with time-critical processes where any delay in spotting problems or opportunities can result in significant financial losses or safety concerns.
What technical infrastructure is required to support effective real-time data visualization?
Supporting effective real-time data visualization requires streaming data capabilities, adequate processing resources, stable connections between data sources and visualization systems, and expandable storage options. Most organizations need specialized ETL tools capable of handling continuous data streams alongside visualization platforms designed to update frequently without slowing down.
How can companies measure the ROI of their real-time data visualization investments?
Companies can calculate real-time data visualization ROI through several metrics: shorter decision-making cycles, better operational performance, less downtime, and faster anomaly detection. Specific measurements like lower inventory expenses or better on-time delivery statistics offer solid proof of investment returns.
What are the upcoming trends in real-time data visualization technology?
New developments in real-time data visualization include AI systems that automatically detect unusual patterns, augmented reality displays for easier data interaction, and edge computing that processes IoT data streams faster. Combining predictive analysis with real-time data visualization tools will help companies not only understand current situations but also predict future outcomes with better accuracy.
Want to learn more how Hopara can help you?
-

- Blog
Five Ways to Reduce Risks in Lab Operations
Precision. Data integrity. Quality. In competitive life sciences labs, these attributes directly impact research continuity, regulatory compliance,...
-

- Blog
Why Lab Environments Demand Innovative New Approaches
Pharmaceutical therapeutic discovery. Biofuel testing. Genomic breakthroughs advancing precision medicine. The unassuming work within life sciences laboratories...
-

- Blog
Unlocking Next-Gen Potential – Key Capabilities of Agile Digital Twins for Labs
While the digital twin concept shows immense promise for revolutionizing lab operations, traditional digital twin solutions come...