Real-time IT Infrastructure Visualization
Hopara simplifies IT infrastructure visualization by providing interactive monitoring of your systems. The platform gives the ability to represent your entire IT environment using custom indicators.
Automated Visualization
Icons are automatically generated based on criteria such as CPU, memory usage, and other performance metrics.
Drill-Down Analysis
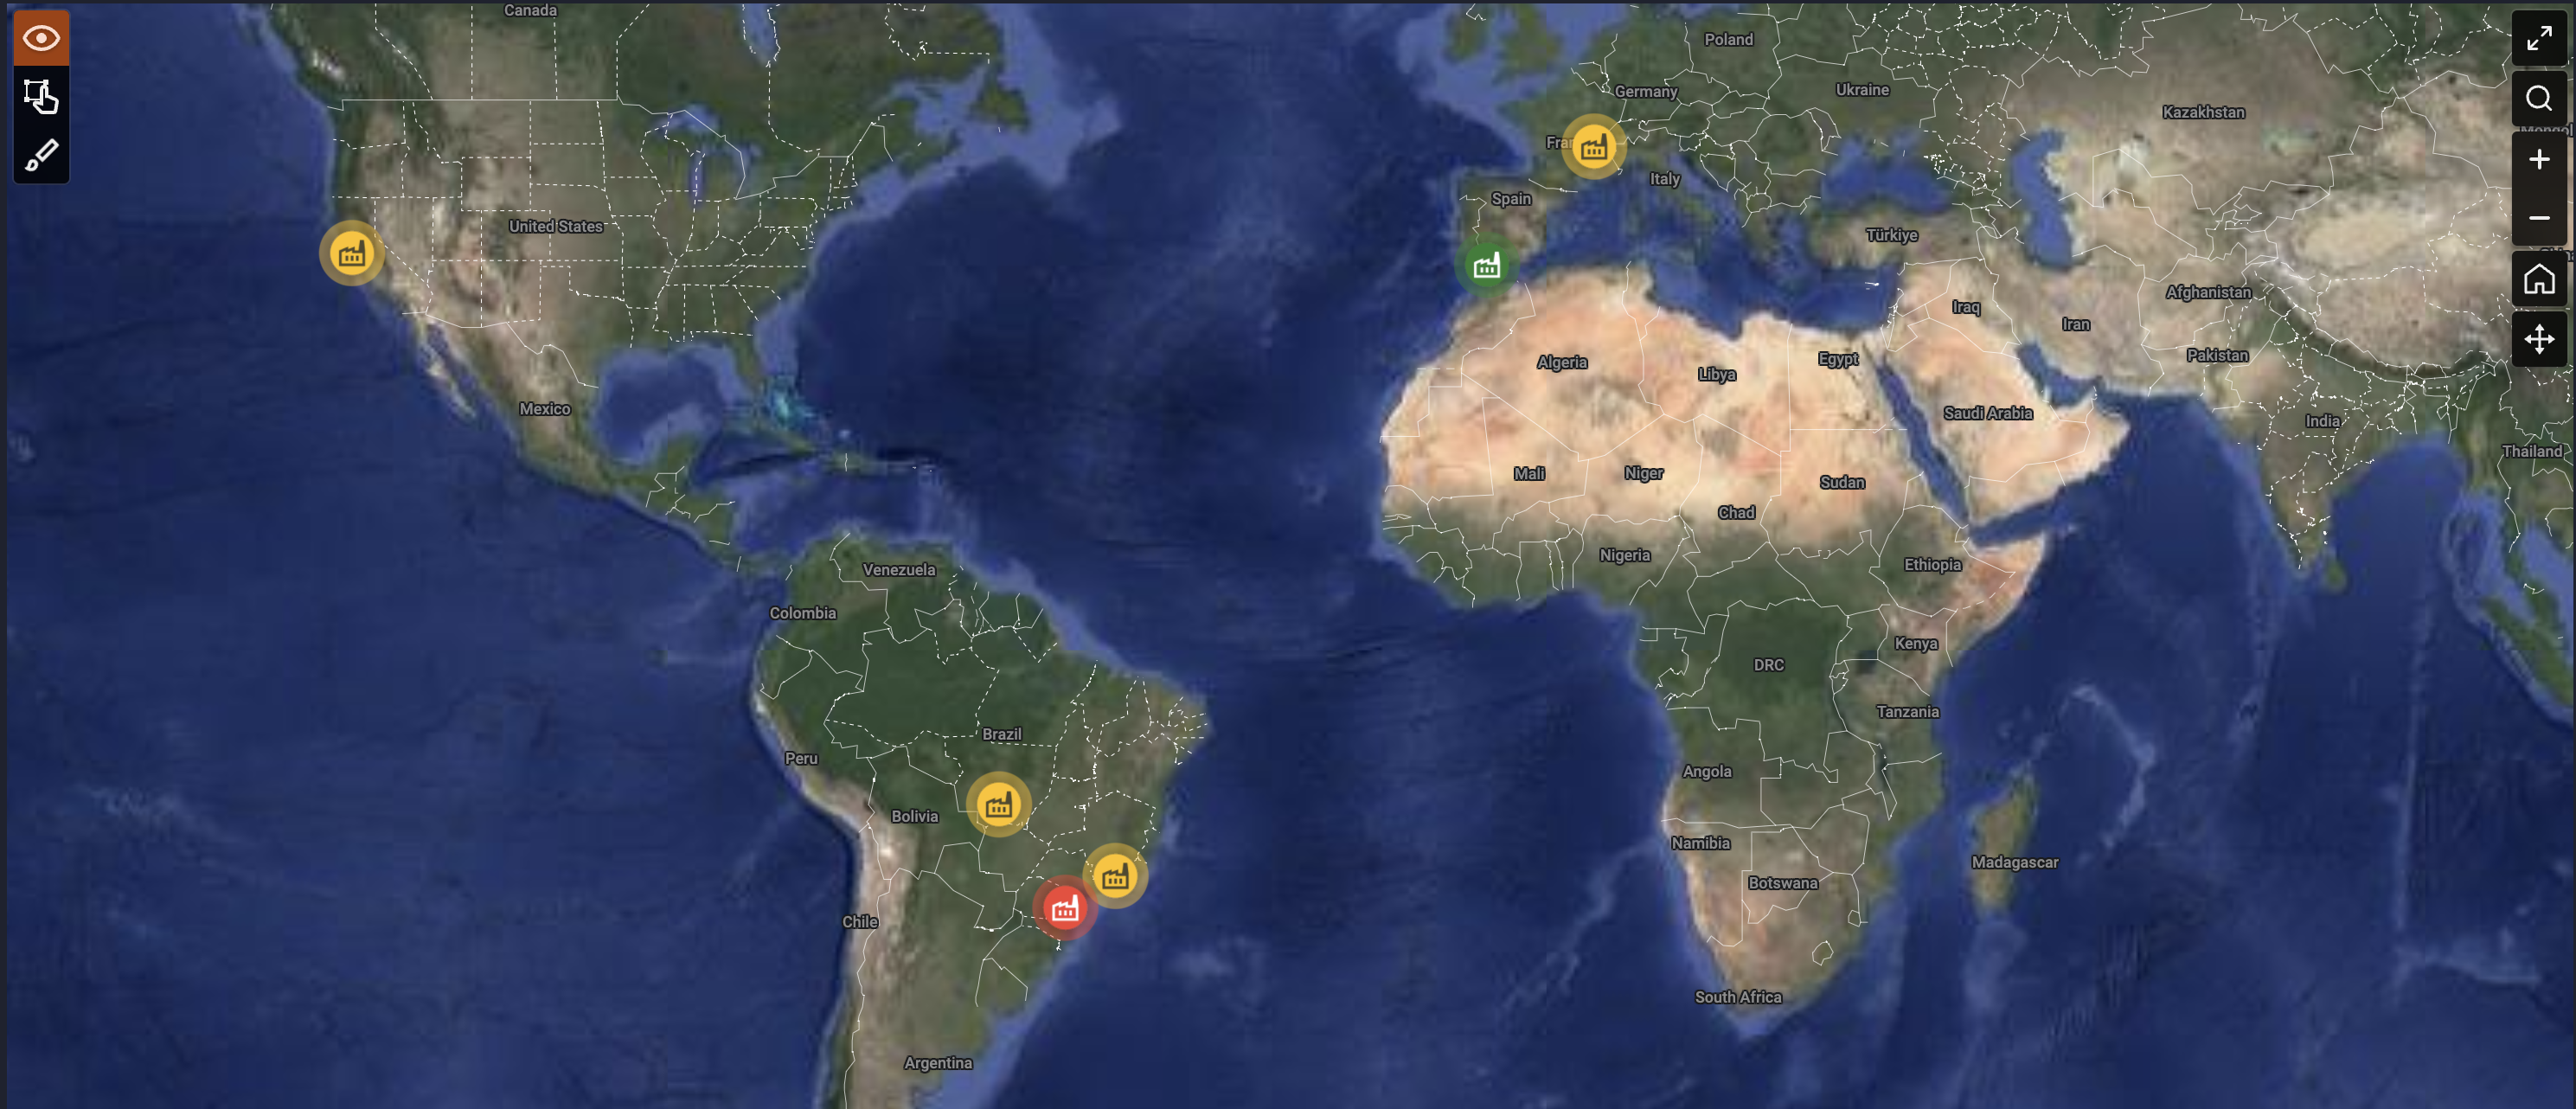
Move seamlessly from a high-level overview to detailed views of individual systems to identify and address issues quickly.
Custom Layouts
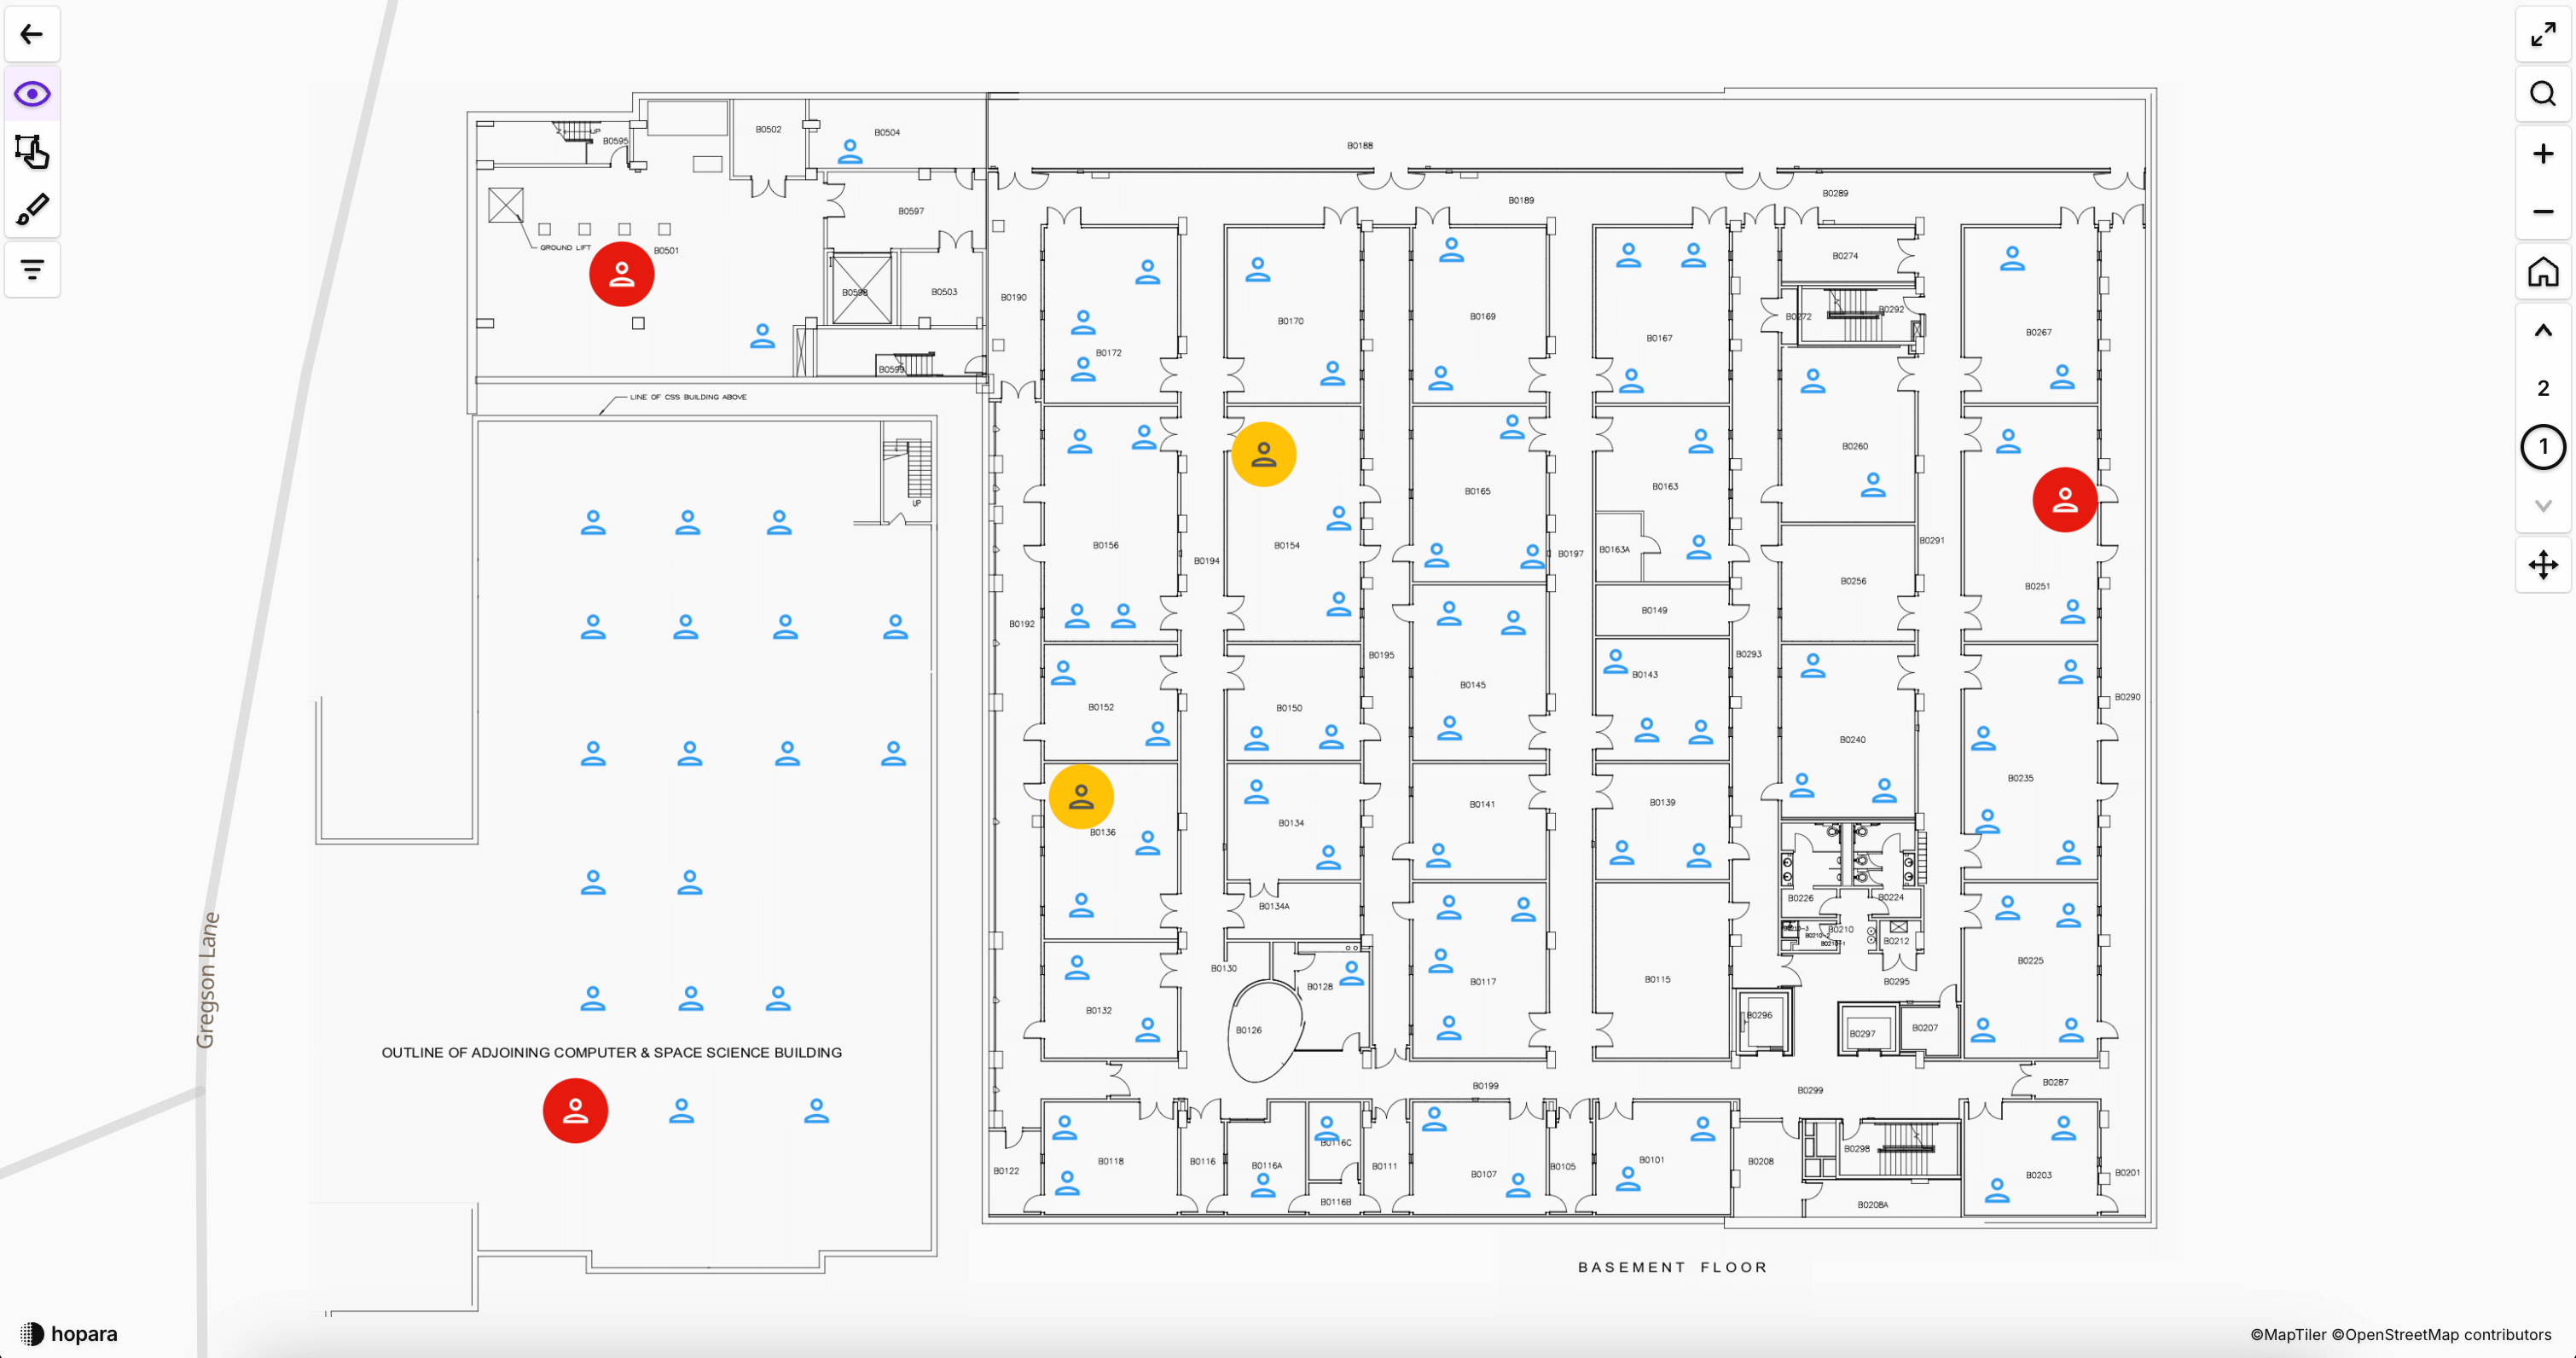
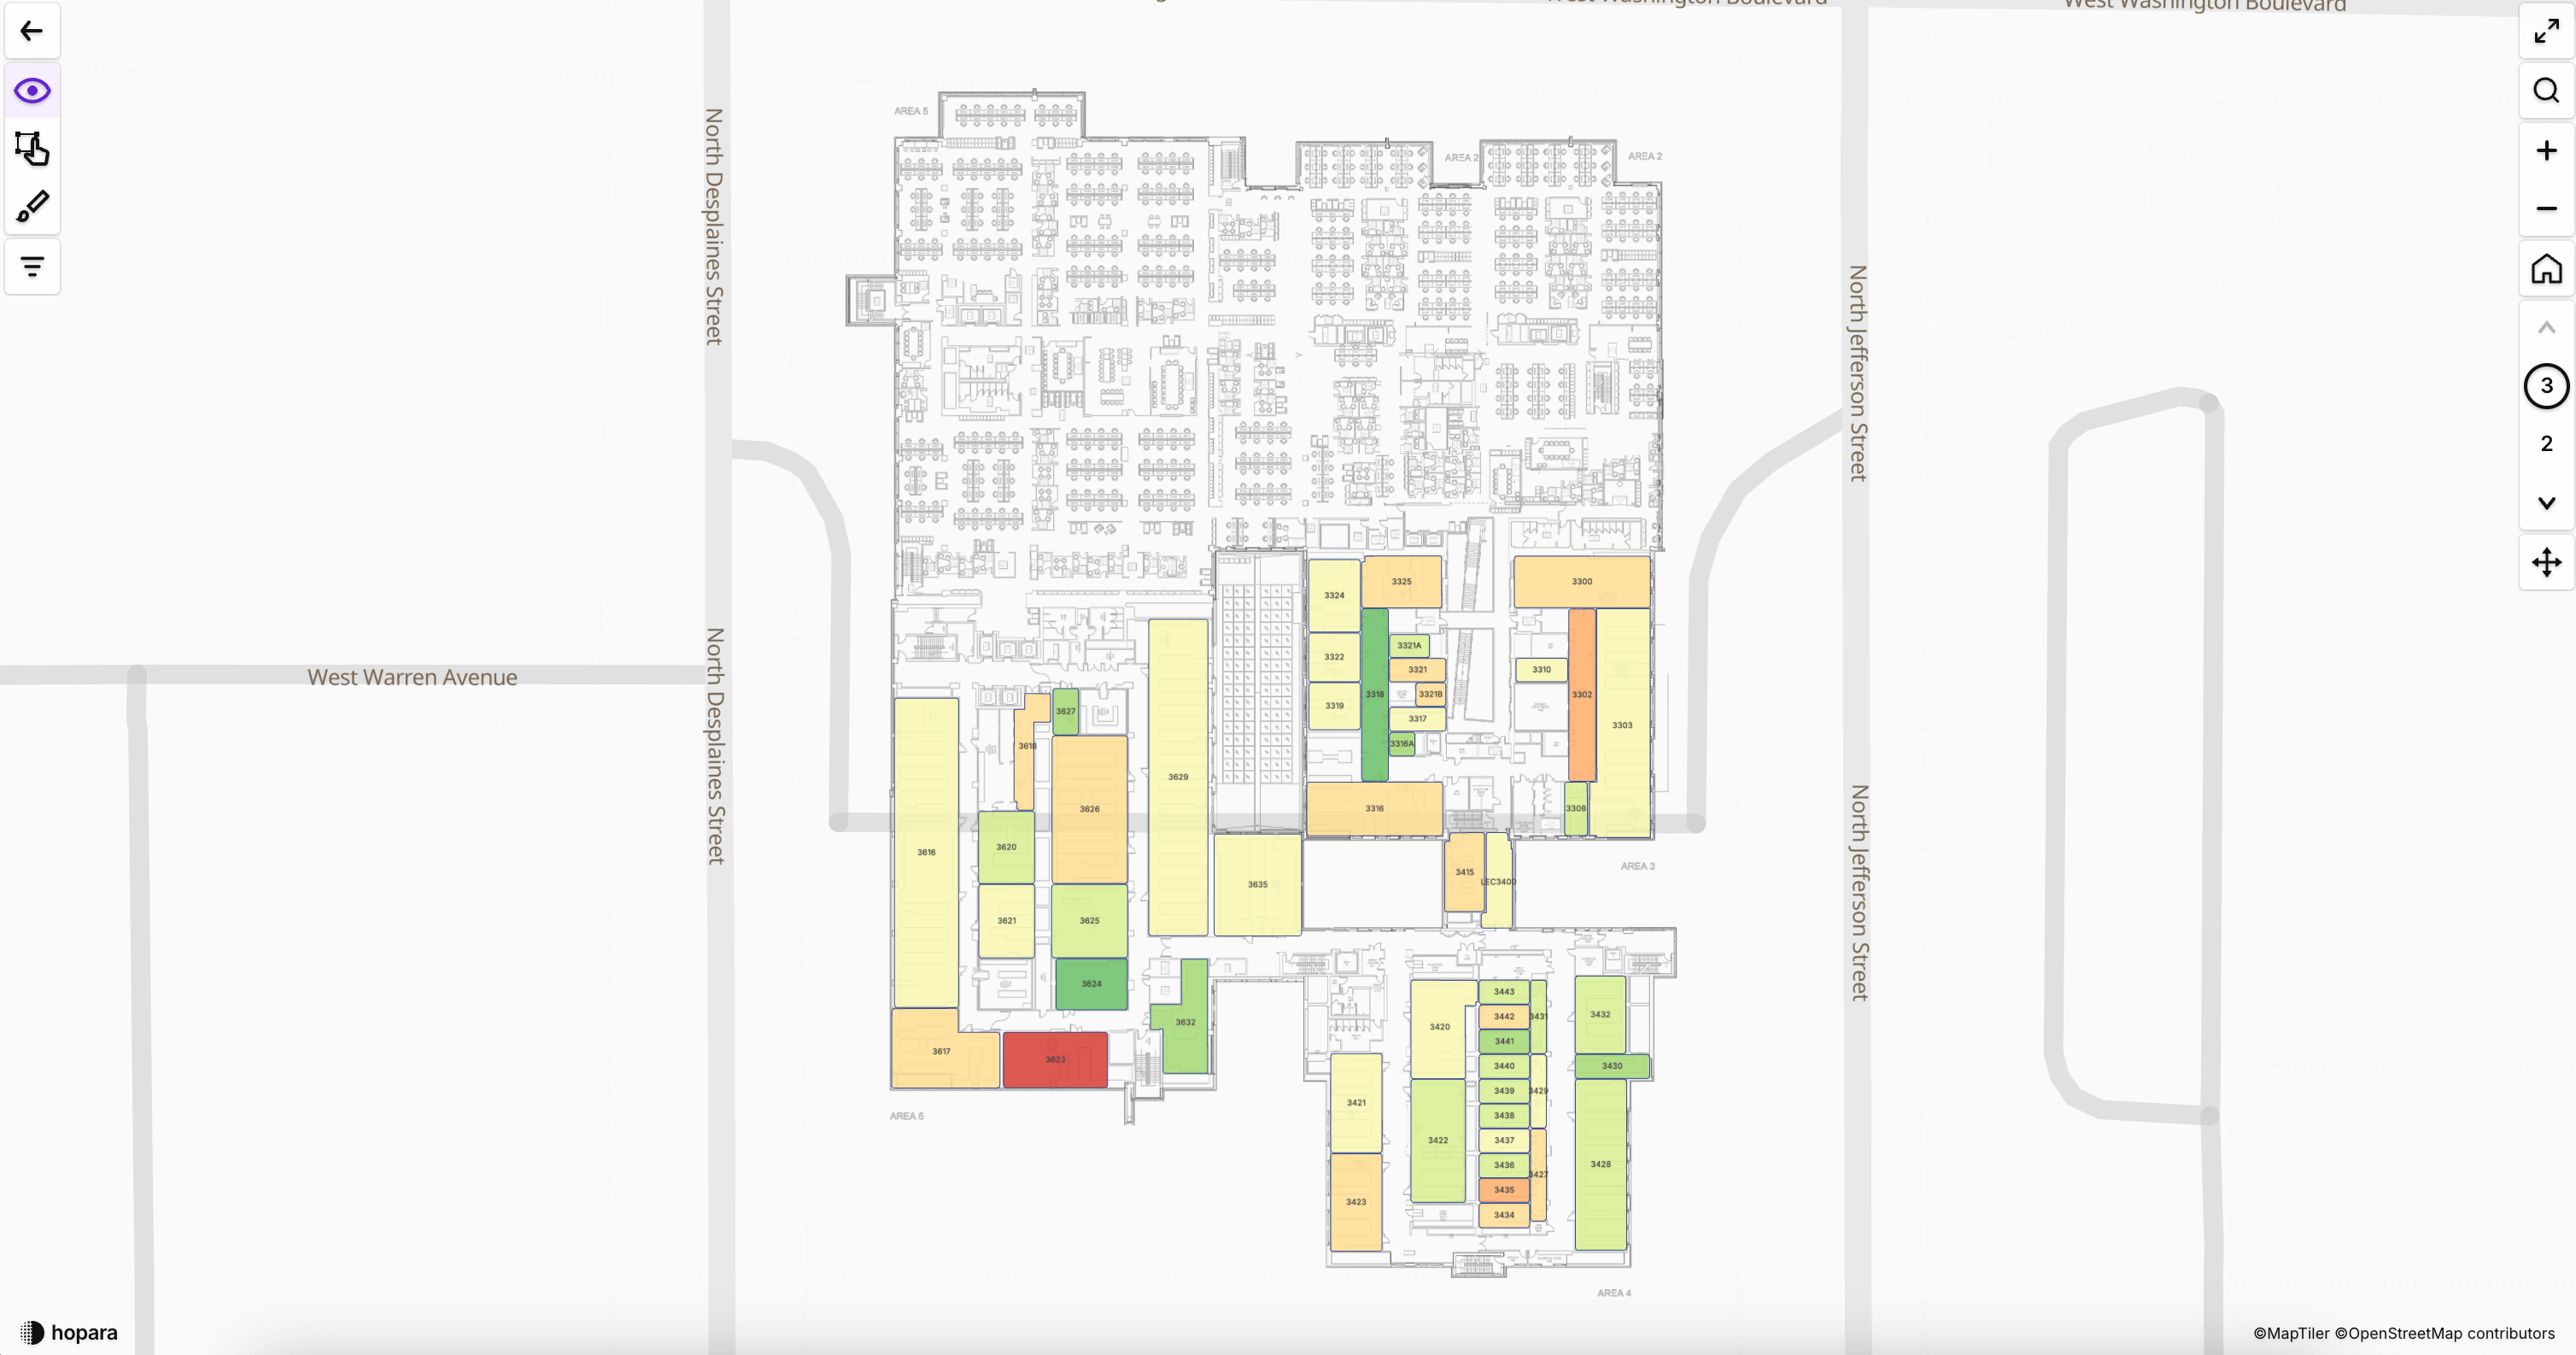
Tailor visualizations with custom backgrounds, such as floor plans or other unique layouts.
Interactive Popups
Hover over any element to reveal full details, including system names, descriptions, and escalation contacts.
Dynamic Actions
Perform actions directly from the interface, such as sending HTTP GET/POST requests or managing server connections.
Responsive Panels
The platform dynamically adjusts to your screen size, offering scrollable panels when necessary for a complete view of your infrastructure.
Monitor, analyze, and optimize IT operations with unparalleled flexibility and ease.
-
Integrated Real-Time Monitoring
Access live data from all connected systems and servers, providing immediate visibility into system health.
-
All-in-One Place
Centralize data from various systems without the need for additional integrations or migrations.
-
Actionable Interface
Perform immediate actions such as restarting servers, triggering alerts, or querying data, directly from the interface.
-
Scalable Solutions
Adapt and expand visualizations as your IT needs grow, ensuring the platform evolves with your infrastructure.


