- Blog
Top 5 Ways To Improve Lab Operations and Monitoring
Scientific research success depends on precise planning and smooth execution. While major discoveries make headlines, the real engine behind research progress lies in efficient lab operations. Managing inventory, maintaining equipment, following safety protocols, and organizing data are fundamental elements that determine research outcomes.
Well-run lab operations directly impact research quality, speed, and reliability. Small improvements in these areas can lead to significant gains in productivity and accuracy while reducing costly mistakes. Smart inventory systems prevent supply shortages that could delay experiments. Regular equipment maintenance prevents unexpected downtime. Proper safety measures protect valuable research and personnel. Implementation of data visualization tools helps research teams streamline their processes and focus on what matters most – generating reliable results. When research facilities prioritize excellent lab operations, they create an environment where breakthrough discoveries are possible.
Understanding Modern Lab Operations and Monitoring
Lab operations serve as the foundation of scientific research, combining essential activities that make experimental work possible and efficient. Strong operational practices directly influence how well a laboratory performs and the quality of research it produces.
Key Operational Components
Successful lab operations depend on several essential elements working in harmony. Proper inventory management prevents experimental interruptions through careful supply tracking and stock maintenance. Regular equipment servicing keeps instruments accurate and dependable, while strict compliance measures ensure both staff safety and research quality. Effective data management tools help teams organize their findings and work together seamlessly, making information readily available for analysis and reporting.
Impact on Research Success
The quality of lab operations and monitoring directly affect research outcomes. When scientists spend their time on actual research instead of administrative tasks, the quality and quantity of their work improves significantly.
Resource Optimization
Smart management of resources lies at the heart of effective lab operations. This includes efficient space allocation, staff scheduling, and streamlined purchasing systems. Clear resource management protocols help labs reduce unnecessary expenses, minimize waste, and maintain steady experimental progress. Many facilities find success with shared equipment programs, which reduce equipment costs while increasing access to essential tools.
Safety and Quality Assurance
Effective lab operations place safety and quality control at the forefront of daily activities. Regular safety training sessions, thorough documentation practices, and careful handling of dangerous materials create a secure work environment. The CDC’s Biosafety guidelines confirm that strong operational protocols lead to fewer workplace accidents while maintaining high research standards.
Real-Time Data Visualization Platform for
IoTLife SciencesData LakesManufacturing
-
Interactive 3D Models
Add relevant context such as floor plans, technical drawings, and maps
-
Semantic Zoom Capability
Effortlessly navigate and drill-down between different levels of detail
-
Configurable Dashboards
Design visualizations exactly how you’d like to see them
Current Challenges in Lab Management
Research laboratories encounter numerous operational difficulties that affect their research quality and productivity. The identification of these issues serves as a starting point for creating practical solutions to improve research outcomes and laboratory performance.
Resource Management Challenges
Laboratory managers face substantial difficulties when handling facility resources. Most laboratories lose significant time managing inventory problems. The continuous tasks of supply monitoring, equipment maintenance scheduling, and budget distribution demand exceptional organization skills. Failed management systems often lead to research setbacks, experimental variations, and wasteful spending.
Data Organization Obstacles
The substantial volume of laboratory data creates serious organizational problems. Research information typically exists across multiple separate platforms, hampering efficient retrieval and analysis. Many facilities still rely on manual data input methods, which introduce mistakes and slow down operations. Limited equipment monitoring capabilities make it hard to evaluate performance metrics and track ongoing experiments. Such organizational shortcomings waste valuable research hours, reduce result precision, and limit potential operational improvements.
Compliance and Safety Management
Laboratory managers must balance strict regulatory requirements with smooth operations. Staff need regular updates on safety procedures, extensive documentation practices, and consistent training programs. Accurate records of equipment certifications and maintenance schedules ensure alignment with industry guidelines and regulatory standards. While these safety measures protect staff and research quality, they often create administrative challenges that impact research timelines.
Team Communication Barriers
Laboratory teams struggle with multiple communication challenges. Multiple shift schedules, distinct job functions, and different technical backgrounds create information gaps between staff members. Insufficient systems for information sharing and task coordination can result in repeated work or incomplete experimental steps. Poor communication directly influences both the quality of research results and overall laboratory performance.
Top Ways to Improve Lab Operations
Hopara provides a modern real time and interactive platform that enables you to improve lab operations through monitoring . Hopara’s platform can help you handle the vast amounts of data that is available through IoT sensors, providing Google Map like capabilities leveraging custom canvases such as floor plans, connecting them to multiple real-time databases, and enhancing user experience to boost daily lab operations and provide real time lab monitoring. This is not something that traditional BI software can easily provide .
- There are many challenges facing Lab operations managers, directors, and QA/QC professionals such as:
- Lack of real-time visibility into equipment inventory and status
- Time-consuming and error-prone manual processes for tracking and analyzing equipment data.
- Regulatory Compliance
- Equipment down time, planned or unplanned
- Environmental variables such as temperature , humidity, etc.
Hopara enables you to visualize your lab environment in real-time providing following benefits:
- Predictive Maintenance: By providing Real-Time monitoring Hopara enables you to visualize equipment health and usage patterns. By analyzing this data, you can predict when equipment is likely to fail. This proactive approach minimizes unscheduled downtime and reduces the risk of experimental disruptions.
- Real-Time Monitoring: Lab managers and QA/QC professionals can access real- time data with Hopara Data Visualization Platform, providing immediate insights into equipment and process performance. This level of visibility allows for rapid response to any deviations or anomalies.
- Compliance Assurance: With Hopara’s ability to record and validate every step of lab operations, you have a robust foundation for regulatory compliance. It helps ensure that processes adhere to standards, helping labs avoid compliance-related risks
- Cost Reduction: Hopara lets you plan predictive maintenance, optimize processes to mitigate risk and reduce costs.
- Environmental Control: By being able to visualize environmental conditions, such as temperature and humidity, Hopara’s data visualization platform helps improve lab operations helping labs maintain stable experimental environments, reducing the risk of experiments being affected by external variables.
Key Capabilities of Hopara for Lab Operations
Hopara provides you with digital representations of physical objects or analog processes that can seamlessly connect to real-time operating data, such as IoT sensors, with an engaging and user-friendly environment.
Minimized Requirements To Build
Hopara eliminates the need for ETL processes or data movement by connecting in real-time to where the data resides. It provides you the capability of having both a 2D and 3D, so you can start with a 2D blueprint and then add 3D as required. Unlike traditional tools, Hopara Data Visualization Platform requires no geospatial data. It provides the ability to visually position floor plans and sensors, and it also helps users get started quickly by including a built-in library of 3,000 icons to represent assets and objects in a 2D format.
With this approach, you benefit in many ways. Prototypes can be built in as fast as hours, and solutions are built and deployed in a week. The time, costs, and data corruption risks associated with data movement are eliminated, and the insights are always highly accurate because the data is always up-to-date.
Low-Code Approach
Hopara provides a no-code/low-code approach which simplifies the implementation process and allows users to easily create different visualizations targeted at specific business use cases. Unlike other tools that require a high level of technical skills and coding expertise, Hopara enables users to achieve their objectives without extensive coding requirements.
This approach enables advanced data visualization solutions to be built and implemented ten times faster compared to coding with traditional tools.
Infinite Adaptibility
Hopara Data visualization and Monitoring Platform offer limitless adaptability to solve a wide variety of use cases. They can be updated and adapted quickly as business cycles change, ensuring flexibility and agility. With the ability to customize every aspect of the visualization from the start, users can easily incorporate new data feeds, such as IoT sensors, or expand the scope to include additional locations without the need for re-coding of the entire project.
With this infinite adaptability unique to Hopara’s solution, users have the ability to target a variety of different use cases and optimize various processes using the same platform. This offers considerable savings in cost and time to adapt or create new visualizations, as compared to alternative solutions.
Advanced Drill-Down
Hopara’s Data Visualization and Monitoring Platform provides advanced drill-down capabilities allowing users to navigate swiftly from the highest level of abstraction to the most granular details. With just a few clicks and in a fraction of a second, users can pan and zoom through data to access the precise information they need in the same way they would browse the Internet. The platform ensures that users see only the relevant data for their specific level of view, eliminating distractions and focusing on decision-making. Data is presented in a visually appealing manner within a “single pane of glass,” enabling users to view and analyze the entire operation spanning multiple sites and a large number of assets, while still being able to drill down into the details of individual assets.
Hopara’s advanced drill-down enables instant business insights that drive real-time decision- making , which increases equipment uptime and availability and reduces costs. With superior insights come greater business value compared to traditional approaches.
Lab Operations and Monitoring Use Cases for Hopara’s Data Visualization Platform
Use Case 1: Enhance Asset Utilization
Problem: In a bustling sciences lab, where experiments are time-sensitive and precision is non-negotiable, lab managers faced a challenge – optimal asset utilization. Aging equipment, resource allocation inefficiencies, and the fear of unexpected breakdowns were all impacting lab productivity and incurring unnecessary costs. Asset underutilization was a persistent concern, hindering both experiments and budget management.
Solution: Hopara’s Data Visualization Platform provides real-time data visualization , offering lab managers unprecedented visibility into equipment utilization. The advanced drill- down capabilities enable lab professionals to swiftly navigate data, optimizing scheduling and asset allocation decisions.
The visually appealing data presentation focuses on relevant information, making it easier to spot areas for improvement. Hopara’s Data Visualization Platform helps labs enhance asset utilization and improve productivity, ultimately leading to significant cost savings.
Use Case 2: Empower Agile Maintenance
Problem: In a life sciences lab, where precision is paramount and experiments must run smoothly, maintenance- related disruptions were a constant headache. Lab equipment breakdowns and incidents were causing costly downtime, delaying experiments, and frustrating lab professionals. Troubleshooting and responding to incidents swiftly were crucial, but the lack of real-time insights and proactive maintenance strategies hindered these efforts.
Solution: Hopara’s Data Visualization Platform enabled real-time monitoring by continuously collecting performance data from lab equipment, providing actionable insights to lab managers and maintenance teams, enabling proactive issue identification and resolution.
They can now more rapidly troubleshoot and respond to incidents, minimizing disruptions.
Hopara Data Visualization Platform is now helping lab operations achieve a proactive maintenance approach, reducing downtime and enhancing operational reliability.
Use Case 3: Predict & Prevent Downtime
Problem: In a life sciences lab where experiments were time-sensitive and downtime was a looming threat, unplanned outages and equipment failures disrupted experiments, leading to data loss, budget overruns, and delays in critical research. The lab needed a solution to schedule preventive actions, minimize disruptions, and elevate operational reliability.
Solution: Hopara’s Data Visualization Platform offered a transformative solution for predicting and preventing downtime. Hopara enabled lab managers to see potential issues before they escalated, allowing for preventative actions based on real-time data enabling timely maintenance and upgrades. This proactive approach minimized disruptions, safeguarded experiments, and maintained the continuous flow of critical lab activities. Hopara’s Data Visualization Platform enabled efforts to avert unplanned outages, reduce risks, and elevate operational reliability in the lab.
Ready to make your lab work better? Contact us to learn how Hopara can improve your lab’s results.
Integrating Hopara Data Visualization Platform into Lab Operations
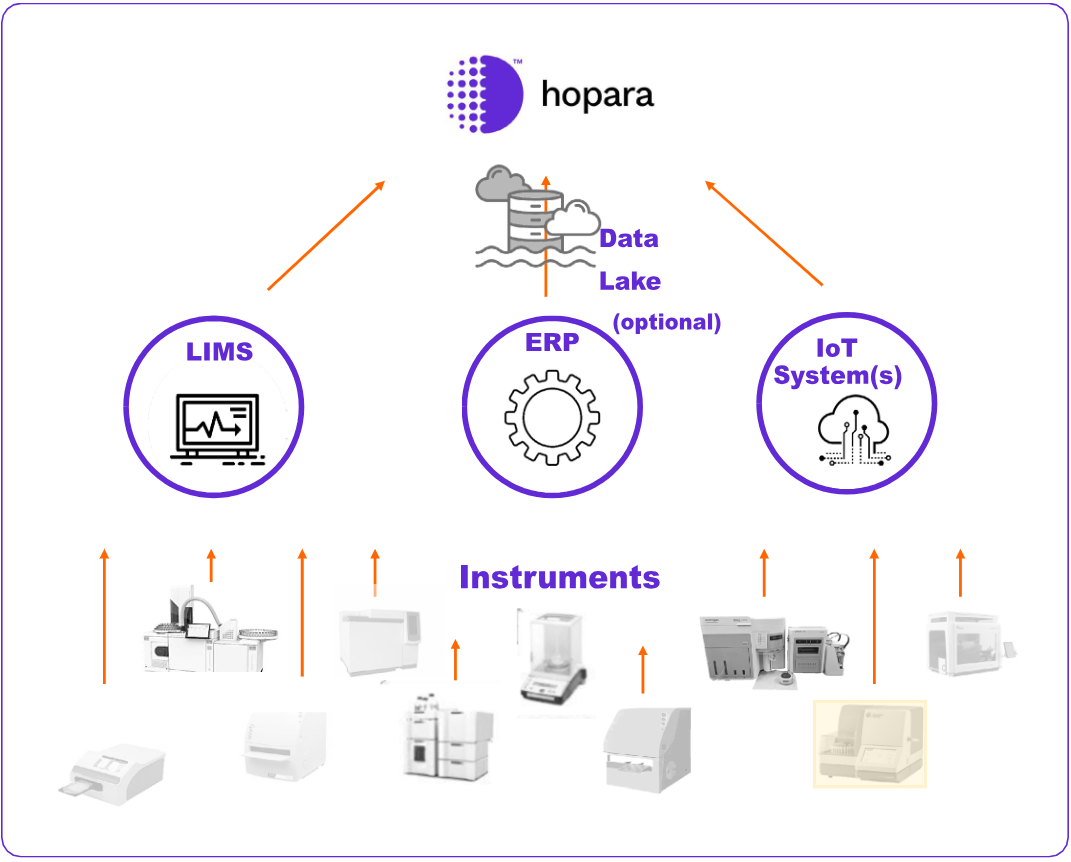
Hopara integrates seamlessly with existing systems through APIs or direct database connections. The diagram below depicts how Hopara integrates within existing environments. All data is fetched live, which means no data is stored in Hopara and all updates reflect immediately. End users can interact with Hopara to get insights in a manner similar to how they browse the Internet.
Conclusion
Labs face immense pressure to deliver reliable results while adhering to rigorous standards. In this high- stakes environment, risks exist around asset maintenance and utilization, and the costs of a failure can be substantial. As this article has explored, challenges like aging equipment, lack of real-time insights, and unplanned downtime can disrupt lab operations and undermine productivity.
However, Hopara’s Data Visualization Platform brings a modern and innovative solution. It provides real time data which provides labs with predictive insights that help mitigate risks. The ability to provide real time data , lab professionals can monitor equipment health and be able to perform reliability-centered maintenance. The continuous tracking facilitates regulatory compliance assurance. By mitigating risks, optimizing operations, and enhancing efficiency, Hopara is set to usher in a new era of lab excellence and transform lab operations.
Contact us to see how Hopara helps research teams achieve better results through streamlined lab operations.
Real-Time Data Visualization Platform for
IoTLife SciencesData LakesManufacturing
-
Interactive 3D Models
Add relevant context such as floor plans, technical drawings, and maps
-
Semantic Zoom Capability
Effortlessly navigate and drill-down between different levels of detail
-
Configurable Dashboards
Design visualizations exactly how you’d like to see them
FAQs
How do lab operations and lab monitoring impact research reproducibility?
Lab operations and lab monitoring significantly affect whether research can be reproduced successfully. Organizations with strong operational standards achieve 40% better replication rates compared to those without consistent practices. Essential elements include meticulous documentation, equipment maintenance tracking, and quality control processes. Clear procedures ensure experiments run under identical conditions each time, leading to more reliable results.
What are the financial benefits of optimizing lab operations?
From our experience, smart management of lab operations reduces costs 15-25% through minimized waste and smarter resource use. Regular equipment maintenance programs extend machine lifespans up to 40%. Labs using automated inventory tracking decrease urgent supply orders by 60%. These improvements create substantial cost benefits over time through reduced expenses and more efficient resource allocation.
How can lab operations support environmental sustainability?
Efficient lab operations make significant environmental impacts through careful waste handling and resource management. Electronic record-keeping cuts paper consumption by up to 70%, while precise chemical tracking prevents unnecessary disposal of unused materials. Labs also reduce their environmental footprint through strategic equipment scheduling and resource-sharing programs among research teams.
What role do lab operations play in regulatory compliance?
Strong lab operations ensure regulatory standards are met through detailed record-keeping, consistent procedures, and systematic auditing. This includes monitoring equipment calibration, tracking staff training, and maintaining safety documentation. Research facilities with organized operations experience 65% fewer compliance violations and related issues.
How can lab operations improve research collaboration?
Effective lab operations strengthen research partnerships through unified methods for sharing data, using equipment, and managing projects. Teams using centralized experiment tracking systems see 35% higher productivity. Clear guidelines for shared resources and communication methods reduce team conflicts and help multiple research groups work together more effectively.
Want to learn more how Hopara can help you?
