2.4
In this release we've made it easier to create dynamic flowcharts. We also added SnowFlake support and auto-rotation for 3D visualizations.
3D auto-rotation
Oftentimes sensors are placed on different sides of an asset. The 3D auto-rotation allows you to keep an eye on all of them.
Text wrapping
To allow the creation of flowcharts from dynamic data, such as asset names, we've added the auto text wrapping option. This option will automatically adjust the text to fit a polygon layer.
Border radius
To improve the look & feel of flowcharts you can now set the border radius in polygon layers.
Snap for polygons
Polygons now align automatically to the nearest polygon in the visualization.
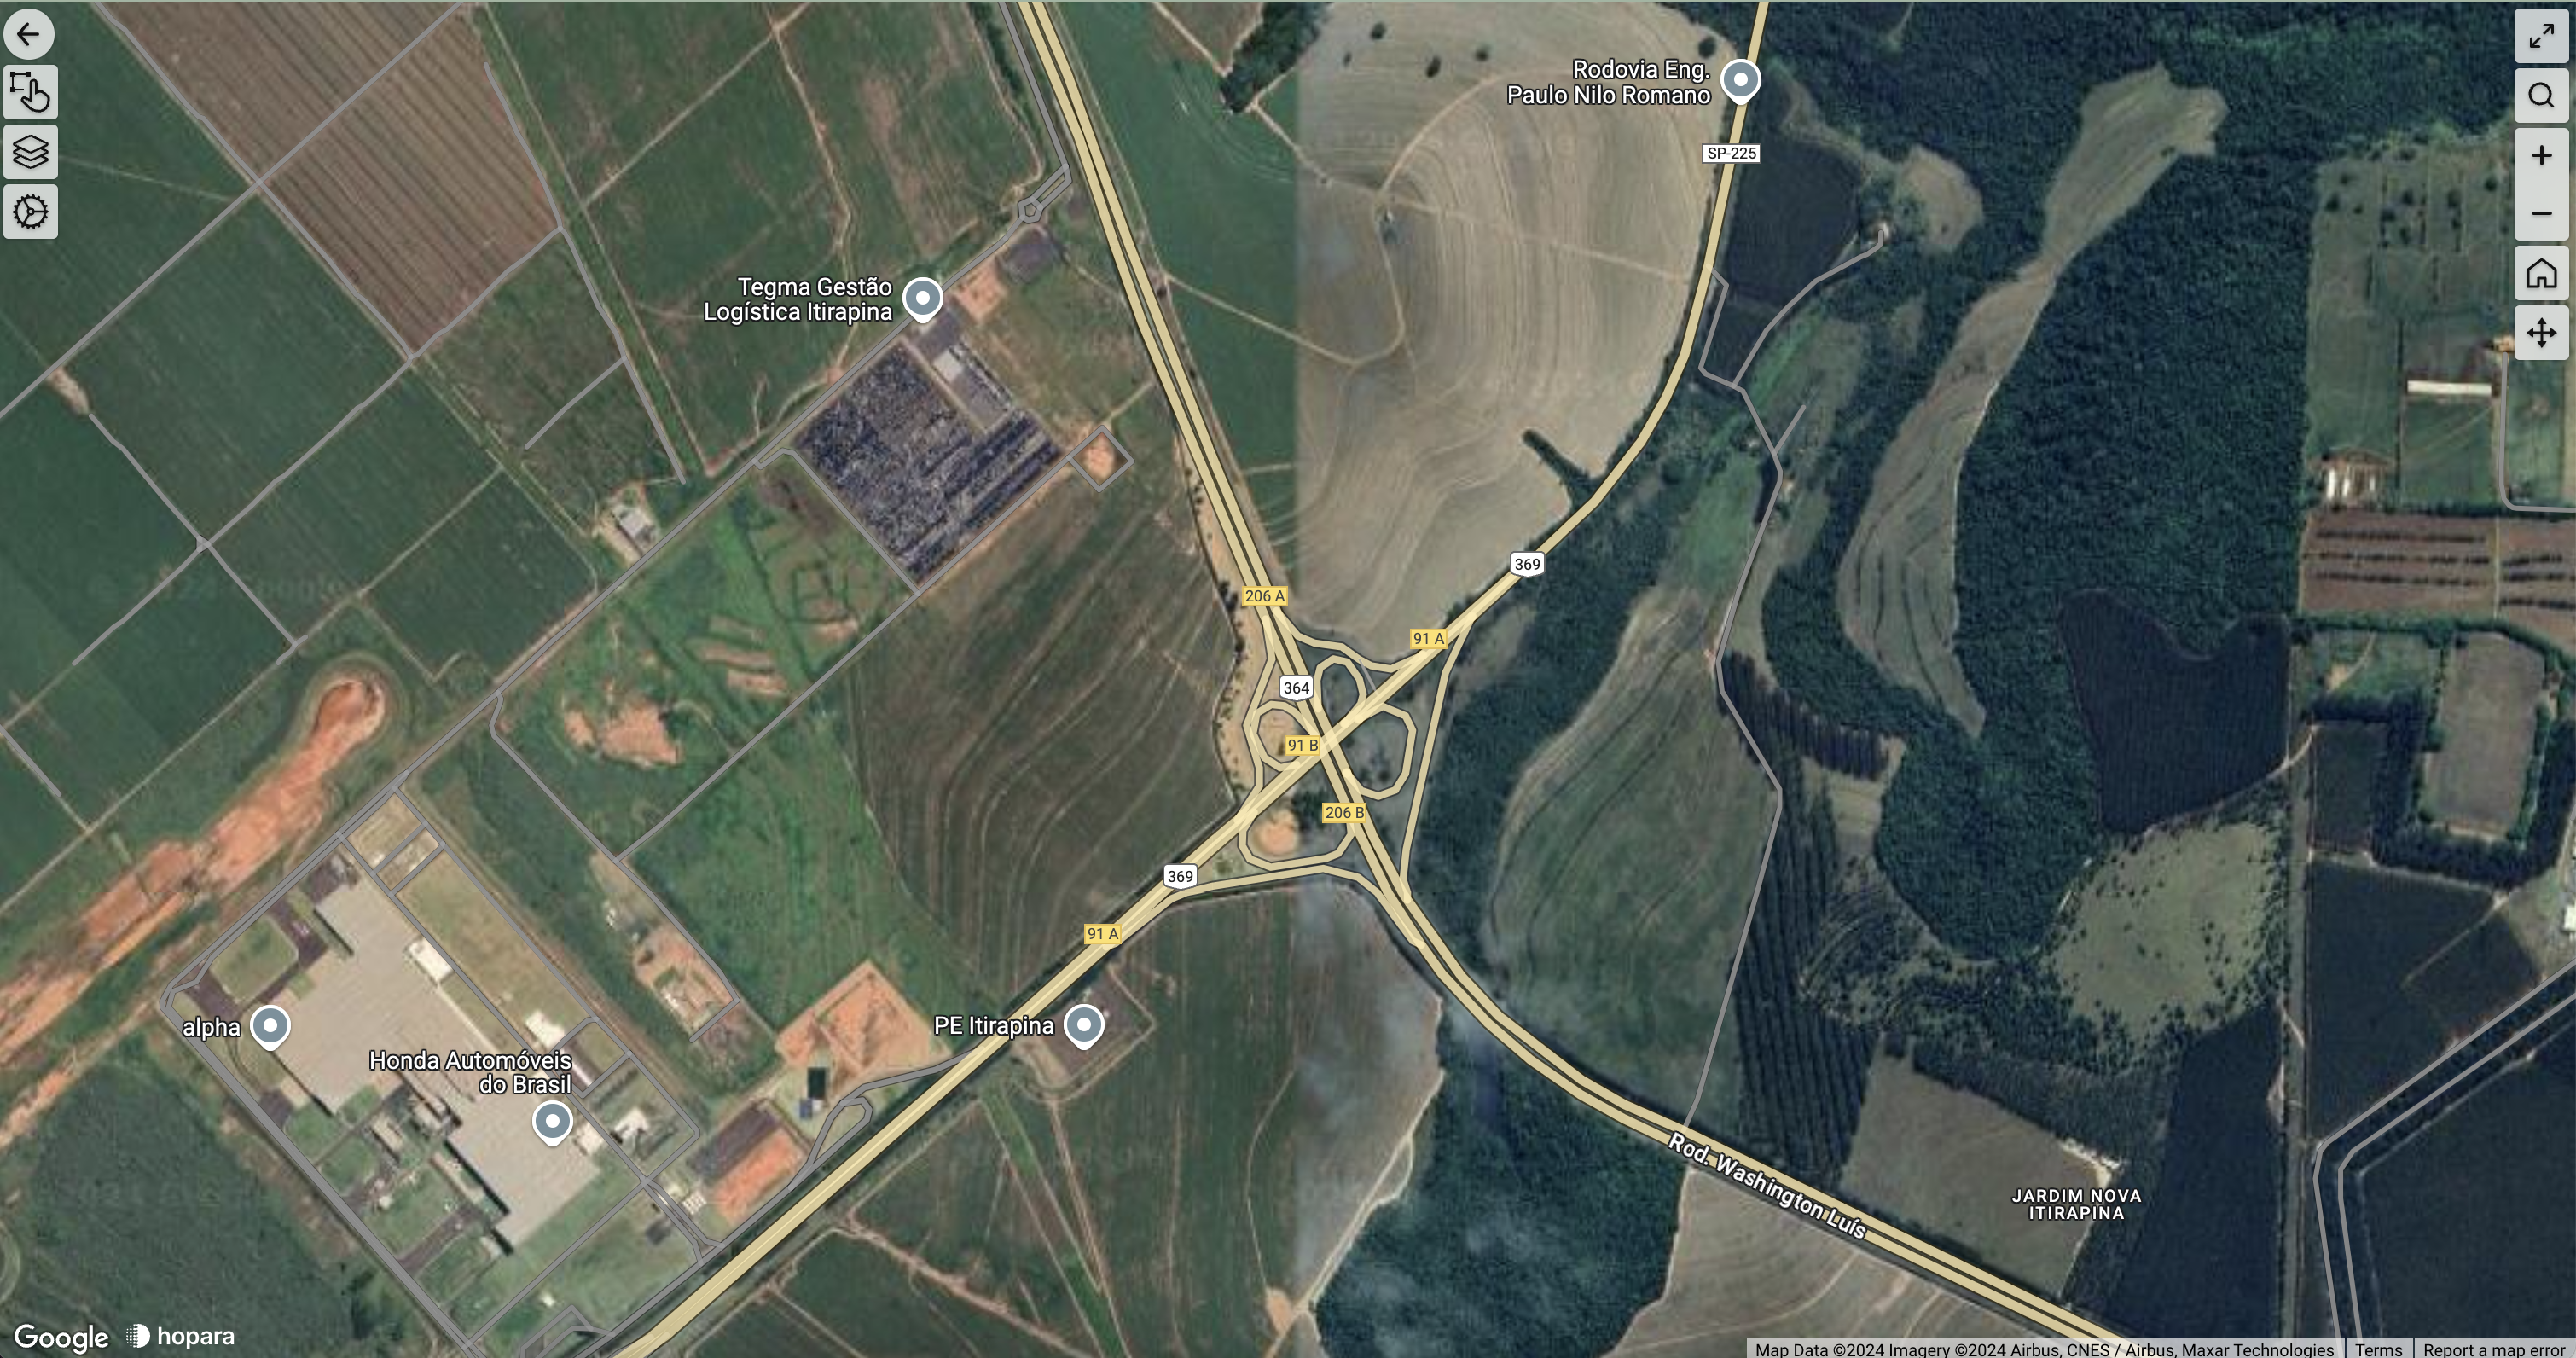
Google maps
To improve outdoor use cases we've added support to Google Maps. This allows you to combine Hopara layers with the high-resolution, up-to-date satellite imagery from Google.
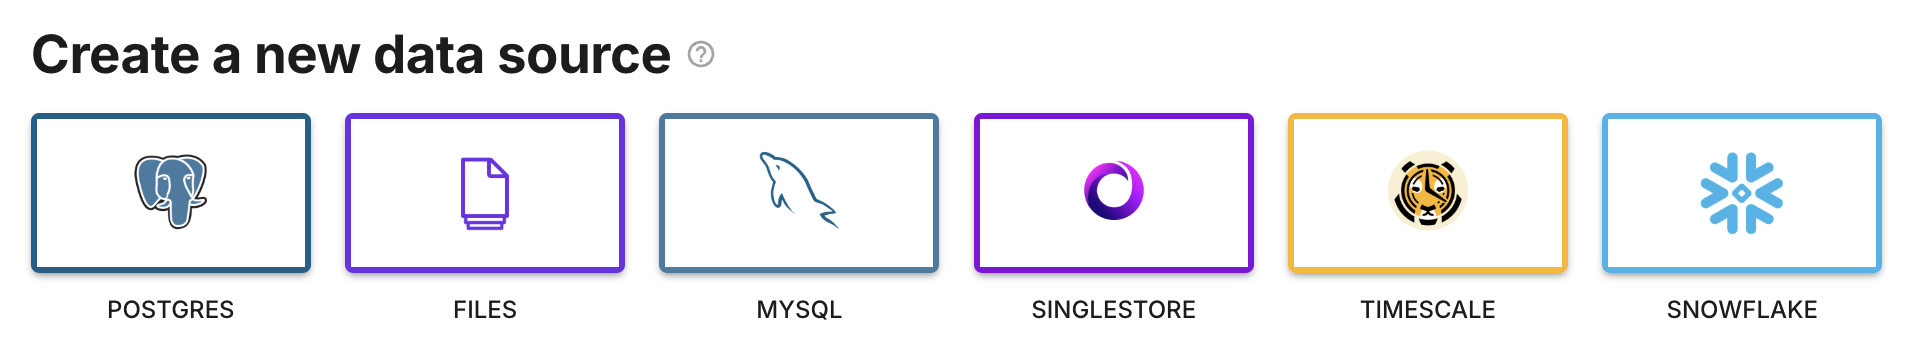
Snowflake support
Now you can visualize your Snowflake data directly in Hopara.
Additional improvements and bug fixes
- New: A new text box template was added
- Improvement: Newly created polygons now take the shape of the last created polygon
- Improvement: When editing, a selection box now appears when hovering an object
- Improvement: Whiteboard layers now have resize turned on by default
- Improvement: When setting the initial position in 3D visualizations the rotation is now saved as well
- Fix: When placing an object on the sidebar, the place operation is now canceled
- Improvement: When updating the size scale the offset now is also updated accordingly
- Improvement: Now an object stays selected after a drag operation
- Fix: Removing an entry in visualization advanced mode doesn't work
- Fix: The object list doesn't show all objects on small screens
- Improvement: Performance improvements
- New: New design of files data source
- New: Added spatial functions support to file data sources
- Improvement: Color and size configurations are now always shown on the top
- Fix: Right click no longer activates pan mode