
The next stage in creating a data-driven organization
Essentially every CEO and Chief Data Officer (CDO) expresses a goal to create a more competitive, data-driven organization. Typically, this means to consolidate their enterprise data in a data lake and to empower data scientists to extract and analyze subsets of this data. However, CEOs and CDOs typically overlook the value of visual data exploration.
In our conversations with organizations, we’ve consistently seen a gap between what they’re achieving today in meeting their KPIs and what they could achieve by exploiting visual data exploration for their big data sets. We call this “the data exploration gap” and explore it in more detail below.
What is the Data Exploration Gap?
The “data exploration gap” has three components:
People: Visual data exploration is a fixture in people’s personal lives, thanks to Google Maps, Uber and other apps, and online games. They can fly around in these worlds, explore and drill down to discover details in their data as needed. People increasingly expect these capabilities in the tools they use at work. When not present (and this is almost always), a data exploration gap is present. Obviously, we should empower their adeptness in this area as an asset to the business.
What if you could exploit this familiar capability to let all kinds of workers organically explore “their” big data and get new insights from the data you’re collecting?
Place: Mobility is becoming even more strategic in the workplace. It’s a given in many critical jobs–from plant or distribution-center managers and always-on HR reps to “bag-carrying” sales reps and off-site technicians. Further, with many organizations adopting remote or hybrid working environments, mobility is going mainstream.
What opportunities are you missing without modern visual data exploration that can operate in this new, mobile-first world, putting exploratory analytics where people “live?”
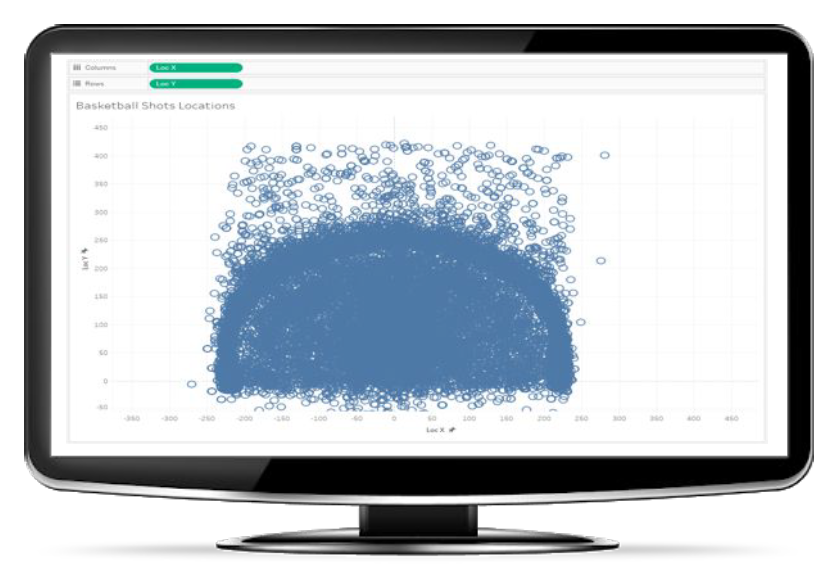
Performance: Current exploration technology–dashboards and data visualizations–works okay with small data sets. However, there’s no drill down to discover details, so what’s displayed is neither visually engaging nor rich. Applying traditional methods to big data usually adds a sea of black dots to small data screens that’s confusing to most people. The picture below shows the result of such over-plotting. Additionally, current methods can’t scale because of memory requirements and user-interface needs of true visual data exploration.
Most worrisome of all: Current tools only support classic analytics (bar charts, scatterplots, regression, etc.). Such techniques require you to have an established hypothesis, which can be then confirmed with data. This taps only a fraction of big-data’s potential value–that piece where the problem is well-established.
What if you could allow virtually any employee to use her knowledge and expertise to come up with entirely new hypotheses? We call this “finding your focus” in a sea of big data.
New visual data exploration technology from Hopara, based on work done at MIT, can provide a data experience that matches the people, place and performance demands of today’s big-data opportunity. Using Hopara, you can increase the impact of all the data you collect.
That was Then. This is Now.
In his seminal 1996 paper, information visualization expert Ben Shneiderman famously introduced a principle known as the Visual Information Seeking Mantra.
Overview first, zoom and filter, then details on demand
He then repeated the mantra 10 times, each line representing “one project in which I found myself rediscovering this principle,” to reiterate the growing importance and utility of this ability. When Professor Schneiderman wrote his paper, it was (arguably) the dawn of the modern big-data era.
Over the ensuing 25 years, organizations have amassed a lot of data, much of it that defines and differentiates them. This data offers high potential, if enough of the right people can explore it and find truly new insights.
However, there’s been persistent challenges in bringing this ideal into practice for big data. Challenges range from visual presentation problems like “squeezing a billion records into a million pixels” and over-plotting (aka information overload), to systems problems like running on mobiles, laptops and other low-memory devices. Initiatives like Pervasive BI–the idea that as many employees as possible should have access to business intelligence in their jobs via the current state of the art (dashboards)–have fallen short as data has grown in complexity, diversity and size.
Hopara wants to enable organizations to build visual information-exploration apps without requiring costly, time-consuming training or special development skills.
By being able to interactively visualize and explore data of interest, people can break free of the constraints of traditional dashboards and keyboards. They can creatively exercise their unique knowledge and expertise.
Click here to see how a supply chain manager might visually explore diverse big data to find new insights.
Next-Generation Visual Data Exploration
Today, visual data exploration can put the power of business intelligence directly into employees’ hands, making it a more-seamless, natural part of their jobs.
Ideally, we need to get to the point where data workers are fully immersed in their data, such that it’s almost invisible. They can see the big picture or drill-down for more details. They can pan, zoom, jump or hop between different data regardless of its format. And they can do this from anywhere, on their mobiles or their “office” PC. Freeing them to just do their jobs.
This is what we’ve built at Hopara. It’s a next-generation data exploration system designed to put more data into the hands of more users. Our Google Maps-like Data Drone Navigation enables a more immersive experience that provides easier detail discovery, faster enlightenment, and more intelligent decisions (no computer science degree required).
The Hopara experience is more like flying through a Star Wars game than navigating through a glossed-up spreadsheet. It’s also currently the only commercially available technology that truly embraces that visionary Visual Information Seeking Mantra.
Will competitive businesses eventually migrate from BI dominated by traditional KPIs and dashboards used by BI elites, to an increasingly immersive, remote-friendly environment for all data workers and business-critical big data applications? We’d like to think so.
Explore your data with Hopara…
We’ve already achieved some impressive results in early trials in machine sensors, customer and product analytics, and health care.
If you’re ready to go for a ride through your data and have a set that you’d like to explore with Hopara, contact us to join our Early Access Program.